Article
An ounce of prevention is worth a pound of cure
An ounce of prevention is worth more than a pound of cure. Or so the adage goes. Yet, the last five years have seen cuts to local government in England – and specifically, to the public health grant - that rank amongst the most severe of the austerity era.
Public health constitutes an ‘up-stream’ intervention, based on the common-sense idea that it is better to stop someone falling into a stream than it is to fish them out later. Cutting it defies both economic theory and fiscal logic. Economic theory, because those who don’t develop avoidable illnesses can often stay in work, with the associated gross value added. Fiscal logic, because treatment is almost always more invasive and more expensive than preventing illness in the first place.
These cuts therefore harm people. But less is known about which demographics and communities are experiencing the most harm. This blog provides new evidence showing that those areas with the highest need have faced the highest cuts, suggesting that the approach to public health during the austerity era has been both unjust and inefficient. In doing so, it continues the work begun by IPPR in the final report of the Lord Darzi Review – Better Health and Care for All (Lord Darzi, 2018)– and in Ending the Blame Game (Hochlaf et al, 2019) – where we have previously evidenced the benefits of increased public health funding.
There have been substantial cuts to services across the most deprived communities in England
During austerity, local government has faced perhaps the most sustained cuts. By 2020, the Local Government Association (LGA) predicts they will have lost 60 per cent of their budget (LGA, 2018), forcing local authorities to make incredibly difficult decisions about the services they provide. In some places, the pressures have been too much, with councils like Northamptonshire facing bankruptcy.
Here, we look specifically at public health. The ring-fenced public health budget has faced hundreds of millions of pounds in cuts since 2014/15. Our calculations, using the latest local government data, show an estimated £850 million decline in net expenditure in England since 2014 (table 1).
Table 1
Estimated real term cuts to public health services 2014/15 and 2019/20 (£). Excluding services transferred to the grant between 2014 and 2019.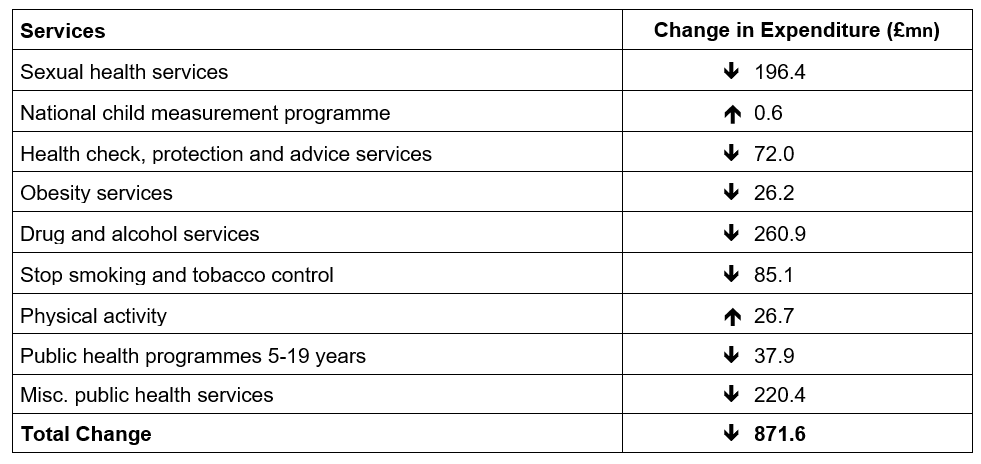
Source: Author’s analysis (Ministry of Housing, Communities and Local Government (MHCLG), 2019)
In the most deprived ten places in England (out of 152) this cut back has been disproportionate – they have borne almost 15 per cent of all cuts.
Comparing those cuts in the most and least deprived ten local authorities, we see just how disproportionate. Almost £1 in every £7 cut from public health services has come from England’s ten most deprived communities - compared to just £1 in every £46 in the country’s ten least deprived places. The total, absolute cuts in the poorest places have thus been six times larger than in the least deprived. In relative terms, the poorest ten places have lost approximately 35p in every £1 of their budget, compared to approximately 20p in every £1 of their budget cut in the least deprived places.
Table 2
Estimated real term cuts to public health in the 10 most and 10 least deprived local authorities 2014/15, 2019/20.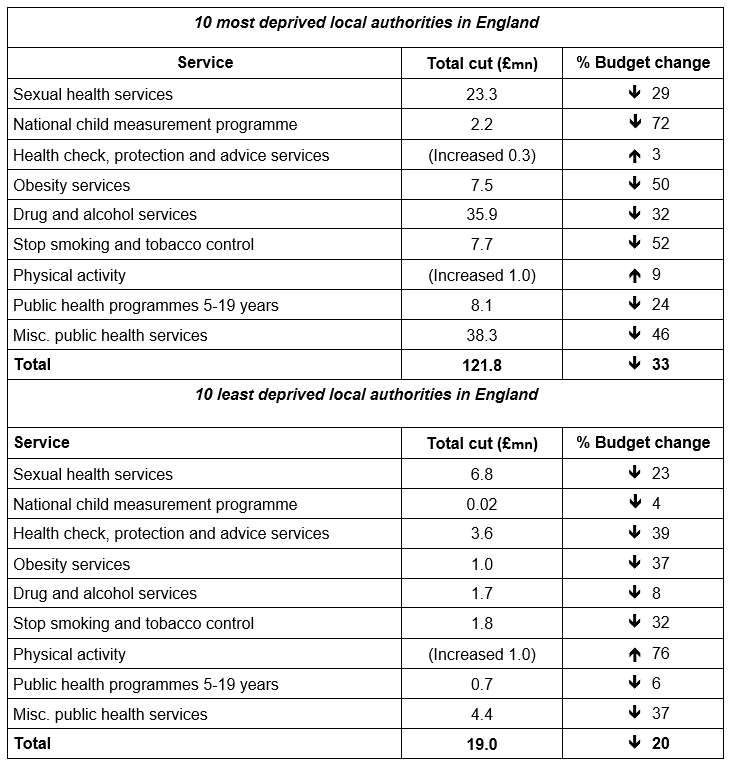 Source: Author’s analysis (MHCLG, 2019)
Cuts have consequences
Cuts in vulnerable communities have consequences for the people who live in them. Research clearly shows how effective some of these services are. Sexual health services have strong Returns of Investment – £11 for every £1 invested in teenage pregnancy and £9 for every £1 spent on contraception, for example (The King’s Fund, 2014; Public Health England, 2018). During the period they’ve been cut, diagnoses of diseases such as like syphilis and gonorrhoea have risen sharply (Lucas, 2013; House of Commons, 2019). Tobacco control aimed at children can generate £15 of benefits for every £1 invested (King’s Fund, 2014). Drug and alcohol services, beyond being good for people’s health and wellbeing, also have a well-established link to crime reduction. It is therefore perverse to see services being cut as the public’s concern about violent crime increases (Public Health England, 2017).
In all cases, these services are disproportionately relied on by people from excluded groups– whether LGBT, BAME, socio-economically deprived or homeless who experience gross health inequalities and who most need community-level support. Smoking is thought to explain as much as half of the almost 10-year gap in life expectancy between richest and poorest in England. An inquiry by the Equalities Select Committee showed LGBT people – already more excluded from NHS services and subject to significant health inequality – also have higher tobacco and alcohol use. Cutting community services that support healthy lives further excludes this vulnerable group (Women and Equalities Committee, 2019).
And beyond that, cutting public health is inefficient. Recent research from the University of York showed that adding an extra ‘quality-adjusted’ life year to someone’s life through public health interventions costs £3,000 (Martin et al, 2019). NICE considers a new drug cost effective at £20,000 to £30,000 for the same outcome. If a drug as cheap and effective as public health interventions were ever discovered, it would be heralded as a miracle.
In sum, the poorest communities, and the people that live in them, are losing the very services that maintain health, produce cost efficiencies and lessen the burden of health inequalities. This is not a distribution that can be tolerated by a just society.
Creating healthy, fair and just communities
A just society must provide for people based on their needs, in their communities. This means a fairer funding settlement for local authorities, who need financial stability to provide the services we rely on for our health and wellbeing. Public health funding presents a clear opportunity.
Firstly, the cuts that have restricted service provision need to be reversed. Secondly, the policies and funding formulas which have meant the poorest places have faced disproportionate cuts – the mechanisms we use to distribute government money - need to be reviewed.
In our recent report Ending the Blame Game, we explored what funding settlement public health would need through the public health grant to remain sustainable going forward (Hochlaf et al, 2019). We argued for a £1 billion uplift in funding (figure 2) – restoring the grant to its peak level (2014/15, Finch, 2018), with a subsequent annual increase equal to that given to the NHS (The King’s Fund, 2018).
Since then, government announced a one-off real term increase for public health funding of 1 per cent. It has not confirmed what strings will be attached to this uplift – and whether local government will be expected to deliver more services when they receive it. Either way, as figure 1 shows, it will do little to restore public health services after years of austerity, even if it were repeated annually going forward.
Figure 1
Even with no strings attached, the government’s 1% real terms increase to public health funding (repeated annually going forward) does little to reverse almost a decade of cuts to ring-fenced public health spend (£ billion)
Source: Hochlaf et al (2019) and author’s analysis
With a 1 per cent real term rise, it would still take until approximately 2027 for public health budgets to recover from austerity and return to their 2014 levels (before even considering inflation). By 2023, it would make £300 million more available for public health services – a full £615 million less than IPPR projections of the minimum sustainable settlement needed.
We recommend Government urgently invests in public health and adopts a fairer approach to local funding and redistribution between areas
Of course, increased public health funding must also be combined with a local authority funding envelope. Beyond public health, local government are responsible for services critical to our health and wellbeing – including social care, parks, green spaces and cycling infrastructure. This must be enough to genuinely empower them to invest in services, rather than fire fight cutbacks.
Moreover, regardless of funding levels, more money is set to be pulled away from the most deprived communities from 2020 onwards. This is because of a change in how funds are allocated between places – ironically named the ‘fair funding review’. Evaluating the impact of the new formula, the Institute for Fiscal Studies concludes:
“[Local] Spending changes have led to significant changes in the relationships between spending and needs indicators. Most notably, the positive relationship between levels of deprivation (as measured by the index of multiple deprivation) and spending has become weaker”. They go on to demonstrate that councils in the most deprived 10 per cent would need 38 per cent more funding than the average to meet associated need but will receive between 5 per cent and 21 per cent below the average. (Phillips and Harris, 2018).
IPPR has previously been clear that central government should increase funding to local government - as part of a long-term and sustainable settlement including devolution of tax-raising powers, and within a fair system of redistribution between areas. Achieving this fair redistribution between areas requires an urgent review of government formulas.
Conclusion
Investing in local government is about investing in the communities people need to live healthy, happy lives. The public health cuts shown here are indicative off an approach to community services in recent history that has, too often, been short sighted.
Moving forward, we need government to recognise the power of communities – and the role infrastructure like public health services plays in them. This means investing in local government and the public health grant. It means better targeting that funding at deprived places, where the need for services is highest, and where cuts have been felt hardest.
Ultimately, it means an urgent departure from a perverse austerity logic that hits the poorest worst.
Chris Thomas is a Research Fellow at the Institute for Public Policy Research.
References
Finch, D, Bibby, J and Elwell-Sutton T (2018) Taking our health for granted, plugging the public health funding gap, The Health Foundation.
Hochlaf, Dean et al (2019) Ending the Blame Game. IPPR. https://www.ippr.org/research/publications/ending-the-blame-game
House of Commons (2019) Sexual Health. Health and Social Care Select Committee. https://publications.parliament.uk/pa/cm201719/cmselect/cmhealth/1419/1419.pdf
Lucas, Stephan (2013) Unprotected Nation. Development Economics. https://www.fpa.org.uk/sites/default/files/unprotected-nation-sexual-health-full-report.pdf
Local Government Association (2018) Local Government Funding: Moving the Conversation On https://local.gov.uk/moving-the-conversation-on/funding
Lord Darzi (2018) Better Health and Care for All: A 10-Point Plan for the 2020s. IPPR. https://www.ippr.org/files/2018-06/better-health-and-care-for-all-june2018.pdf
Martin, Stephan et al (2019) Is an ounce of prevention worth a pound of cure? Estimates of the impact of English Public Health Grant on Mortality and Morbidity https://www.york.ac.uk/media/che/documents/papers/researchpapers/CHERP166_Impact_Public_Health_Mortality_Morbidity.pdf?utm_source=The%20King%27s%20Fund%20newsletters%20%28main%20account%29&utm_medium=email&utm_campaign=10721199_NEWSL_HWB_2019-07-22&dm_i=21A8,6DSJ3,VQBK8K,P9HXE,1
Ministry of Housing, Community and Local Government (2015) “English Indices of Multiple Deprivation” Dataset. https://www.gov.uk/government/statistics/english-indices-of-deprivation-2015
Ministry of Housing, Community and Local Government (2019) Local Authority Revenue Expenditure and Financing 2014/15 to 2019/20https://www.gov.uk/government/collections/local-authority-revenue-expenditure-and-financing
Phillips, David and Harris, Tom (2018) The Fair Funding Review: Is a fair assessment of councils’ spending needs feasible. Institute for Fiscal Studies. https://www.ifs.org.uk/uploads/publications/comms/R148.pdf
Public Health England (2017) “How Alcohol and Drug Treatment Helps to Reduce Crime” Blog. https://publichealthmatters.blog.gov.uk/2017/11/02/how-alcohol-and-drug-treatment-helps-to-reduce-crime/
Public Health England (2018) Contraceptive services: estimating the return on investment. https://www.gov.uk/government/publications/contraceptive-services-estimating-the-return-on-investment?utm_source=26490afe-f039-4007-ba27-6f9971c3ce5d&utm_medium=email&utm_campaign=govuk-notifications&utm_content=immediate
The King’s Fund (2014) Making the Case for Public Health Interventions. https://www.kingsfund.org.uk/audio-video/public-health-spending-roi
Women and Equalities Committee (2019) Health and Social Care and LGBT Communities: First Report of the Session. https://publications.parliament.uk/pa/cm201920/cmselect/cmwomeq/94/94.pdf
Annex
The most and the least deprived 10 places in the UK, according to the Index of Multiple Deprivation.
Table 3
10 most deprived local authorities 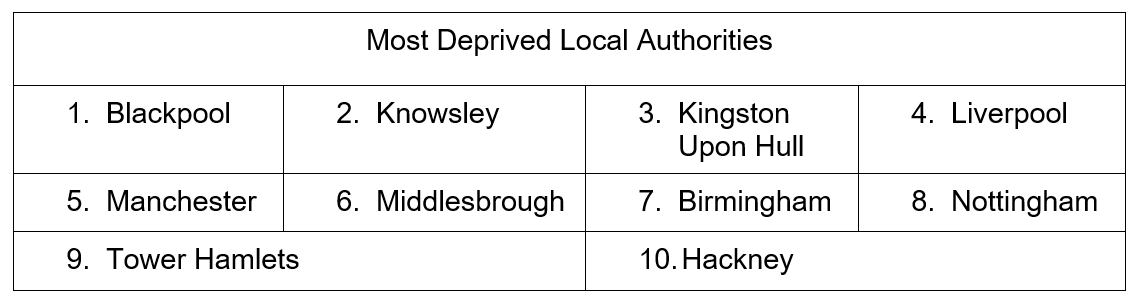 Source: MHCLG 2015
Table 4
10 least deprived local authorities 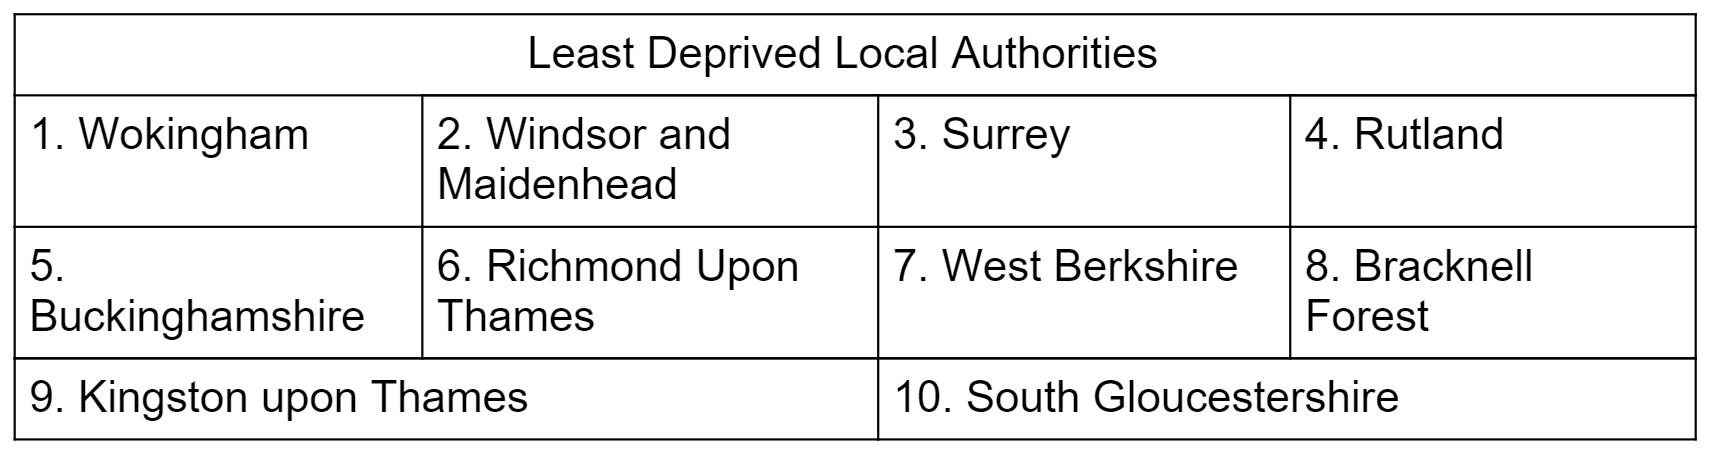
Source: MHCLG 2015
Related items

Who gets a good deal? Revealing public attitudes to transport in Great Britain
Transport isn’t working. That’s the message from the British public. This is especially true if you’re on a low income, disabled or living in the countryside. The cost of living crisis has exposed the shortcomings of our transport system,…
Bhargav Srinivasa Desikan on TalkTV discussing AI
IPPR's Bhargav Srinivasa Desikan on TalkTV discussing his new report on the impact of generative AI on the UK labour market.
Transformed by AI: How generative artificial intelligence could affect work in the UK – and how to manage it
Technological change is a good thing. It has brought exponential gains to living standards and is the foundation of modern society. Yet unmanaged technological change has always come with risks and disruptions.