Press Story
Analysis of official figures by the think tank show the gap in ‘gross disposable household income’ – the money people have available for spending or saving – between the North and the rest of the country.
Using the Office for National Statistics data, IPPR North found:
- Disposable income in the North is £2,300 lower per head than the rest of the country.
- Disposable income of Londoners was the highest in the country at £22,500 per head in 2013 - £7,000 higher than the North - though people living in London face higher housing costs. Disposable income for the North stands at £15,300. The UK average is £17,600.
- Northern regions have long had some the lowest levels of disposable income per person in England, but since the recession have bounced back stronger than some other areas. Disposable income per head grew by 8.6 per cent since 2009 – more than in London (8.0 per cent), but a little behind the UK growth of 9.3 per cent.
- The three Northern regions performed differently over this time period: the North West’s GDHI grew by 7.9 per cent (worse than any other region apart from Northern Ireland), Yorkshire & the Humber 9.0 per cent; and the North East 10.2 per cent – this was among the best rates of regional post-recession growth.
- While there are some local areas with high levels of disposable income in the North, they compare poorly with the rest of the country: just two, Cheshire East and North Yorkshire, made the top 50 of 173 richest areas in terms of disposable income per head. Only five local areas were above the UK average for GDHI per person – all 36 other Northern areas all fall below the UK average. Blackburn with Darwen had the least disposable household income per head in the North, at £12,300.
While the Government’s Northern Powerhouse agenda is welcome, IPPR North says a key test of its success must be how it translates into higher living standards for people living and working in the region.
It says central government and combined authorities should coordinate policies in areas like skills and transport infrastructure to create stronger local economies.
Luke Raikes, research fellow at IPPR North, said:
“Correcting the imbalances in our nation’s economy is about more than just stronger economic growth figures or faster journey times – we have to improve the quality of life and incomes of people in the North too. These figures show the Northern Powerhouse has a long way to go before people in the North feel the benefit of a stronger regional economy.
“The North should pursue growth and prosperity built on higher wages, more jobs and stronger productivity – not simply try to catch up to London and the South East, where the type of economic growth they’ve experienced has created high levels of inequality and left many behind.
“IPPR North has shown how Northern prosperity can create national prosperity: if we increase household wealth to the OECD regional average, then every household will be nearly £500 better off each year.
“But without a step change in policy the North will not be able to escape the historic underperformance of its economy, and contribute more to national growth. The Northern Powerhouse will be meaningless for the people who live and work in the North unless the economic growth it generates reaches their pockets.”
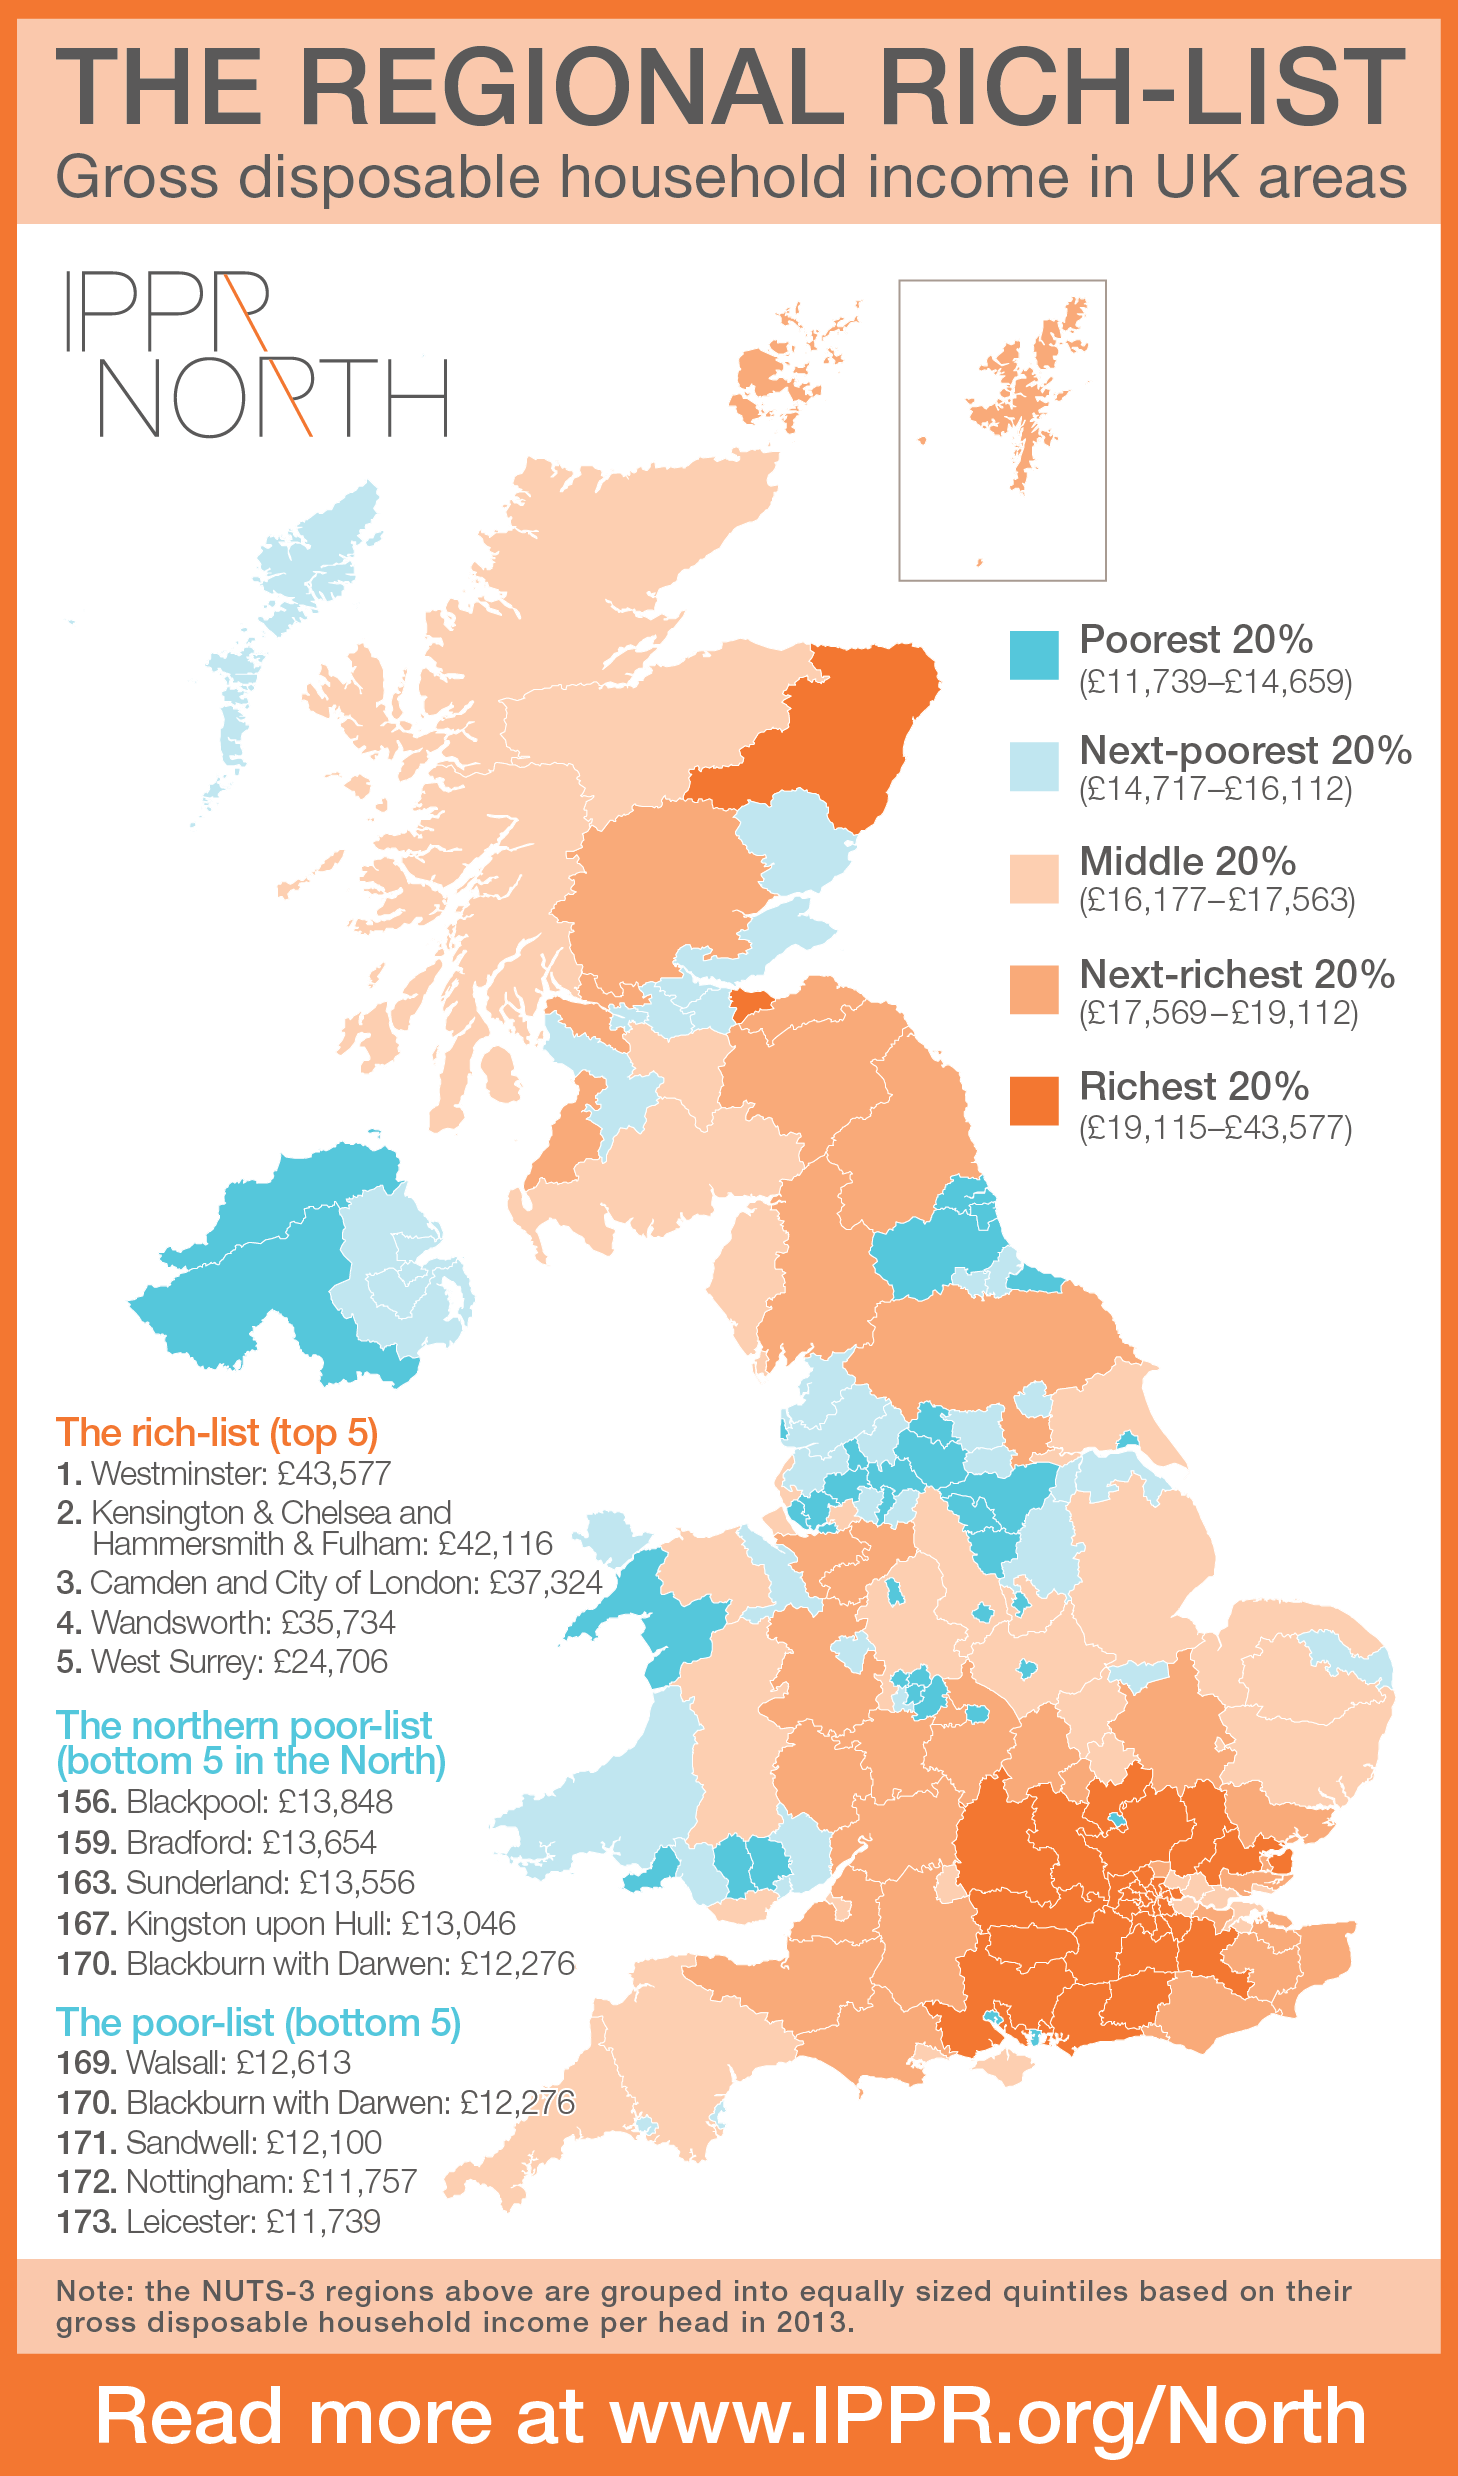
The below map illustrates the distribution of the richest and poorest areas in the UK in terms of gross disposable household income per capita, grouped into equally-sized quintiles. It also lists the top-five richest and bottom-five poorest areas in the UK of the 173 shown, as well as the lowest-ranking areas in the North – many of which, as the map illustrates, fall near the bottom of the list.
Notes to Editors
- IPPR North’s State of the North report in October will set out how the North’s economy is faring. The research is a comprehensive, evidenced-based analysis of the challenges and opportunities for the Northern economy.
- IPPR North analysed the Office for National Statistics Regional Gross Disposable Household Income (GDHI), 1997 to 2013 figures, available here.
- The ONS defines GDHI (Gross Disposable Household Income) as follows: Gross Disposable Household Income is the amount of money that individuals (that is, the household sector) have available for spending or saving. This is money left after expenditure associated with income, for example taxes and social contributions. It is calculated gross of any deductions for capital consumption.
- All figures quoted in this release are at current (i.e. nominal) prices. GDHI per person is the estimated values for each person, not each household.
- There are three Northern regions – the North West, Yorkshire and Humber and the North East. There are 173 local areas ranked by the ONS in the data.