What would it take to eradicate child poverty in Scotland?
Article
Delivering on the First Minister’s commitment to ‘eradicate’ child poverty seems a long way off.
The Scottish government is set to publish a new set of child poverty statistics for 2024-25. While we expect some movement in the figures due to improvements in the DWP’s analysis, we can be pretty confident the figure will not suggest Scotland is on track to reach the Scottish government’s 2030 child poverty target. The Scottish government’s own modelling, earlier this month, shows it expects to miss its targets by a wide margin – 18 per cent rather than the 10 per cent target in 2030. Delivering on the First Minister’s commitment to ‘eradicate’ child poverty seems a long way off.
Why are we finding it so hard to cut the child poverty rate? Scotland does not want for creative and considered suggestions for how to tackle poverty. What it lacks is a credible programme to implement these at a scale that matches the statutory commitment to a 10 per cent child poverty rate or the rhetorical commitment to eliminating child poverty.
The big components of the Scottish government’s strategy are income from work, social security benefits and the cost of living. Much good work is done by the Scottish government on all three strands, but across all of them there are real constraints on what the current approach can achieve.
The Scottish Child Payment (SCP) is the standout achievement of the Scottish government’s anti-poverty policy, and it really makes a difference – it has cut the child poverty rate four to five percentage points. But politicians see little fiscal space to increase it significantly. The SCP represents around half a billion pounds on the government’s budget. The wider outlook is for a £4.7 billion gap to emerge in the budget by the end of the decade.
On income from work, the stark reality is that child poverty is not primarily an issue of underemployed parents. While employability support is hugely valuable to those it supports, this group represents only a small share of the child poverty issue. Our analysis last year found that even with heroic (some might say unrealistic) assumptions on the impact of employability support, child poverty would remain stubbornly high.
On the cost of living, the Scottish government can and does support children in various ways including free bus travel. Not all of these count on the poverty-ledger, though, which deals with disposable income rather than costs. The exception is the cost of housing, and here the history of Scottish policy being distinct from the rest of the UK does make a significant difference.
Figure 1 shows two measures of poverty. First taking into account income before housing costs (so earnings, benefits, etc. less income tax, council tax, etcetera. – see DWP’s description for more). On this before-housing-costs (BHC) measure, child poverty – the proportion of children living in a household with an income below 60 per cent of the median, accounting for differences in household size – looks very similar in Scotland as the rest of the UK. It is on the after-housing-cost (AHC) measure that Scotland has a significantly lower child poverty rate. (AHC income is BHC income less housing costs rent, mortgage interest payments, water charges, some insurance premiums).
Figure 1. The child poverty rate in Scotland before housing costs has tracked the rest of the UK very closely, but after housing costs fewer children in Scotland are in poverty
Child poverty rates in Scotland and the rest of the UK, averaged over rolling three-financial-year periods, excluding 2020-21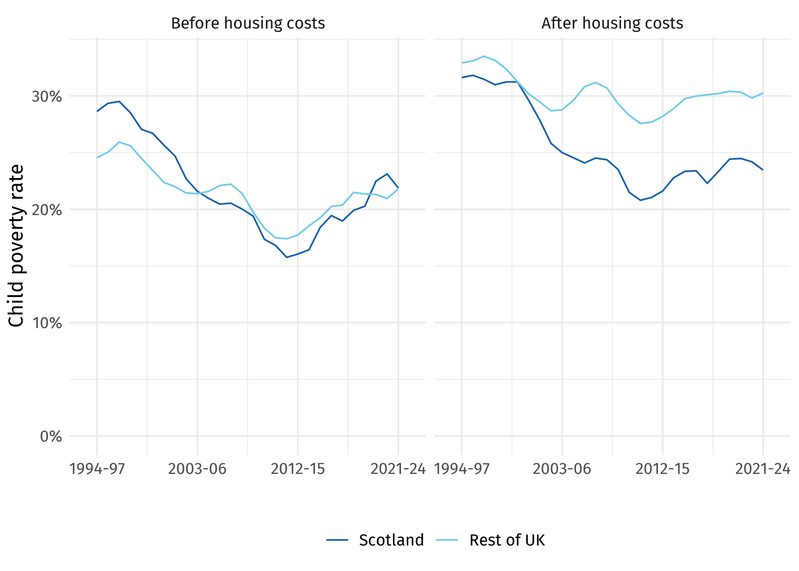
Source: DWP (2025) Households Below Average Income data set
Scotland generally has lower housing costs than the rest of the UK. This is true for households in the lower half of the income distribution and across tenures. The effect is amplified by the fact that Scotland has more social housing per head than the rest of the UK, and fewer children live in private rented accommodation. The causes reflect both different policy choices for social rents (where, in England, past policies on social rents tended to faster increases than Scotland) and less pressure on the housing system, Scotland’s population having grown about 10 per cent since 1994 as compared with the rest of the UK’s 23 per cent increase (based on ONS population estimates).
By how much does Scotland’s lower housing costs keep child poverty rates lower than the rest of the UK? The question resists a precise answer as housing costs affect BHC income via housing benefit. However, we estimate it is broadly of the order of five percentage points.
Current housing policy is unlikely capable of taking another five or so percentage points off the child poverty rate. New powers to regulate private rents were created by last year’s Housing (Scotland) Act but apply in narrow circumstances – this may prevent the worst of rent increases but is unlikely to lead to private rents actually falling.
On social housing, the affordable housing supply programme aims to support 110,000 new homes (from 2022 to 2032), of which at least 70 per cent would be for social rent. If the proportion of these homes occupied by families in the bottom half of the (BHC) income spectrum with children reflects the current pattern (around a fifth) this would mean around 15,000 more such families in social housing by 2030. While this would take a meaningful chunk out of the roughly 50,000 such families privately renting, it clearly wouldn’t resolve the role of private rent in child poverty.
However, the programme faces challenges of rising land and construction costs. Layer on top analyses suggesting a housing programme adequate to need would require £8-£9.2 billion over the next parliament, almost double the Scottish government's plan to invest £4.1 billion over four years. The outlook for housing policy to plug the gap in the child poverty targets is not compelling.
What does this mean for the outlook for eliminating child poverty? Figure 2 shows the distribution of AHC income (adjusted for household composition) relative to the poverty line across the Scottish population.
Figure 2. The distribution of disposable income across Scotland leaves a significant poverty gap
Modelled equivalised AHC income relative to the poverty line across Scotland 2026-27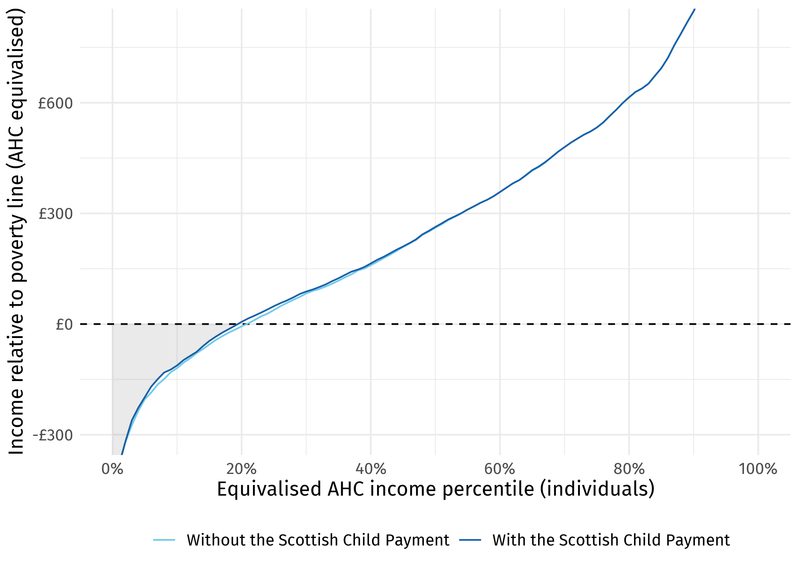
Source: IPPR Tax and Benefit Model
The poverty gap is the amount of extra income households in poverty would need to cross over the poverty line. It represents the area under the horizontal zero line and above the curve, shaded in the figure. It amounts to around £3.8 billion in 2026-27, of which around a third, or £1.2 billion, is extra income needed by households with children (estimates based on IPPR Tax and Benefit Model).
However, tackling poverty is more complicated than the poverty gap implies. Policies that increase the incomes of households below the poverty line tend also to have the effect of lifting incomes just above that line. Various factors contribute to this, including the practicalities of designing interventions, issues of fairness, and preserving economic incentives, particularly around work. This is illustrated in the chart by the modelled impact of the Scottish Child Payment, which supports people across a broad income range, not just those who were otherwise below the poverty line. Policies that eliminate poverty will have to boost incomes on the left-hand size of the chart by much more than the £1.2 billion child poverty gap would suggest.
This is difficult. The important constraint here is the amount of income available across the whole economy. With recent productivity downgrades and the outlook for growth weak, it is not plausible to anticipate higher overall incomes shifting the left side of the curve upwards to any great degree on any reasonable timescale.
Instead, if Scotland is to make more significant progress bringing the child poverty rate down, the upward movement towards the left-hand side of the chart would have to be balanced by downward movement somewhere on the right-hand side.
There are lots of different ways this could be achieved – taxes, shifting people out of private rents (cutting landlords’ incomes), funding social housing, directly boosting benefits, shifts in wage structures, etcetera. But they all imply a flatter income distribution which in turn means greater sharing of our resources. We should not be afraid of this – international evidence shows more equal societies do not have weaker work incentives. Indeed, their economies can be more productive than the UK’s.
Tackling poverty means tackling inequality, and tackling inequality is not a credible proposition if it isn’t accompanied by agreement across society to share our resources more evenly. Getting this fundamental point embedded is crucial, the choice of policy to implement the change is secondary. Politicians setting out commitments to eliminate child poverty should be explicit about tackling both ends of the income distribution and use the hearing they get through the election campaign to champion this case for a flatter income distribution.
Clearly there are choices to be made as to how the higher-earner end of the curve would change under a policy package sufficient to the child poverty targets. This includes where along the curve disposable income would be lower – whether concentrated just at the top (fewer people affected, but to a greater degree) or from a broader base (a smaller impact across a larger share of the population). But until politicians set out clearly how they propose to tackle both ends of the issue we will be left with unfulfillable pledges and a stubborn lack of movement on child poverty.