Article
Like many a newspaper headline, local election results are often quickly forgotten. One side might claim to have made a 'breakthrough', another forced to hide its embarrassment, but even so the political caravan usually moves on and the excitement and despair is forgotten. After all, people do not always vote in the same way in local elections as they would in a general election,1 while there is always the possibility that the wheel of fortune will turn once more before MPs themselves have to face the electorate. Interesting though they may have been, the results are soon put to the back of people's minds.
Ukip's success
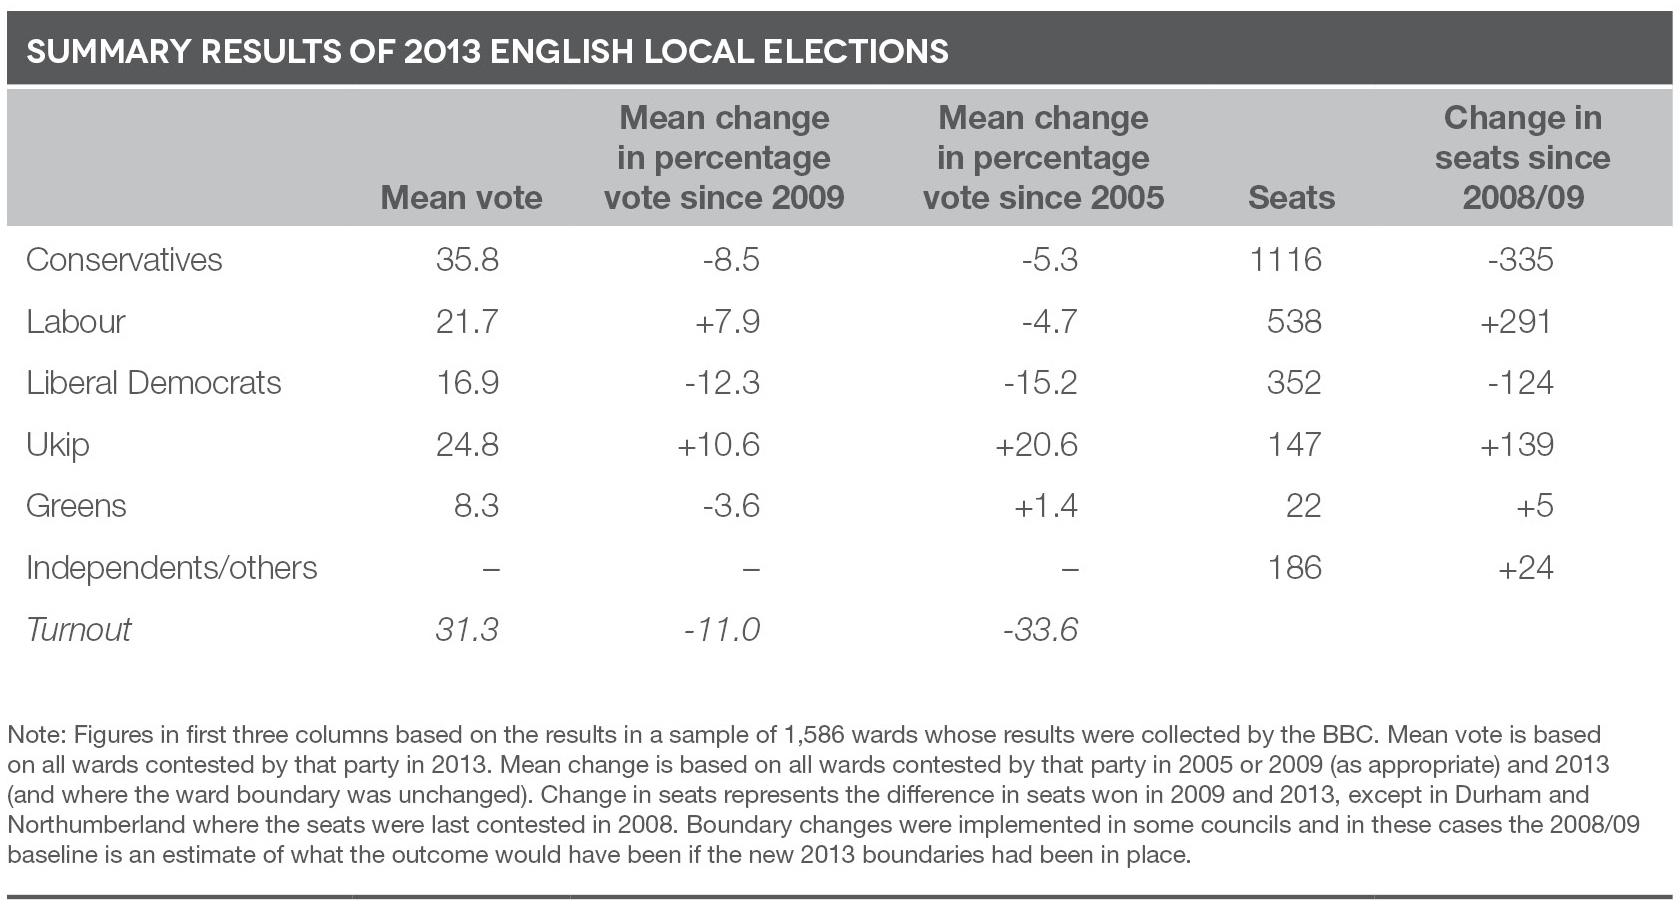
Not so the local elections of 2013, when predominantly more rural, shire England had the opportunity to elect their local county councillor. Following on from its meteoric rise in the opinion polls during the previous 12 months, accompanied by some record-breaking parliamentary by-election performances, Ukip achieved the remarkable feat of winning 25 per cent of the vote on average in those wards that the party contested (some three-quarters of the total; see table 1). This represented by far the biggest-ever incursion into English local electoral politics by an independent fourth party in the post-war period, easily outstripplng the achievements of the Greens in late 1980s and early '90s. Ukip's success has erected a very large question mark over the future of politics in Britain.
Not only did Ukip outperform the Liberal Democrats, they also left Labour trailing in their wake, albeit in a part of England where Ed Miliband's party struggles for votes at the best of times. However, this achievement was not reflected in terms of seats won: on this criterion Ukip still trailed a distant fourth. The party's vote proved to be far more evenly spread than that of the three Westminster parties, with the result that it ended up with many a creditable second but relatively few firsts. The first-past-the-post system thus insulated the traditional party system from the full force of the electoral earthquake - and could yet still play an important role in stopping the incursion from breaching the barriers at Westminster.
Table 1: Summary results of 2013 English local elections
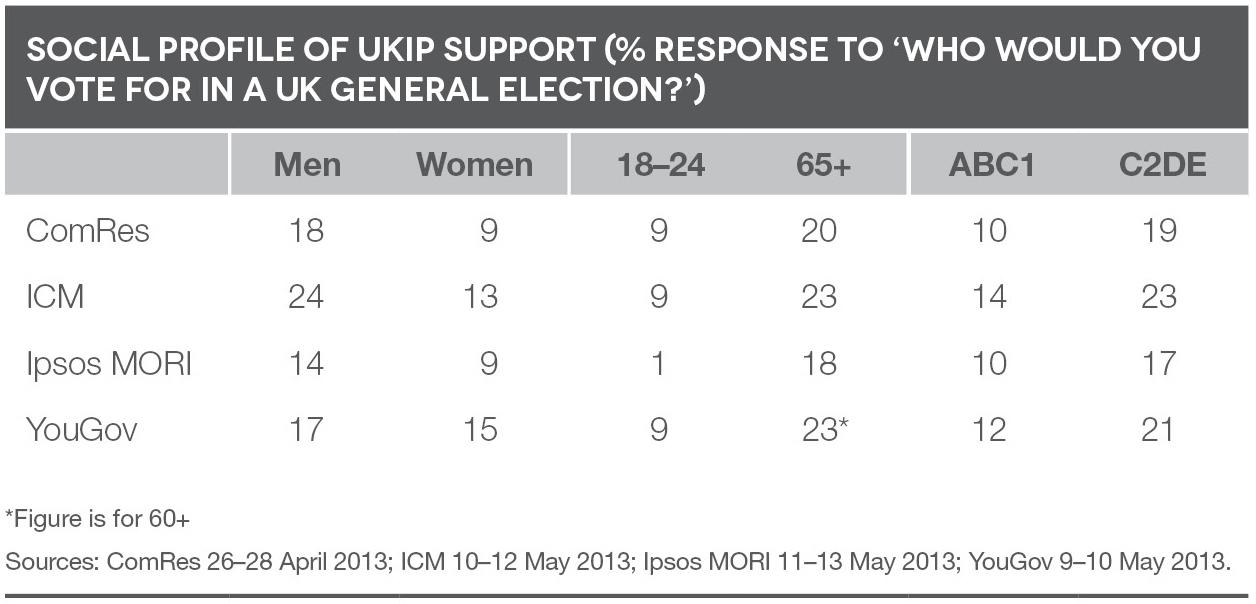
Geographically evenly spread though it is, demographically Ukip's vote is far from being a typical slice of England. Rather, as table 2 shows with reference to four Britain-wide opinion polls conducted at around the time of the local elections, those who back Ukip are disproportionately male, older and working class.2 Bearing in mind that class could well be a proxy for education, this is precisely the kind of social profile one would expect for a party that has developed its core belief in withdrawal from the European Union (EU) into a broader social conservatism focused on concern about immigration and gay marriage.3 This link between Europe and immigration is potentially made salient in the public mind by the relatively high levels of immigration that were occasioned by Britain's decision to extend without delay freedom of movement rights to citizens from central and eastern European countries when those countries joined the EU in 2004.
Table 2: Social profile of Ukip support (% response to 'Who would you vote for in a UK general election?')
Indeed, more than one opinion poll has attested to the importance of the immigration issue to Ukip's appeal for many voters. A survey of voters in Eastleigh conducted for Lord Ashcroft immediately after a by-election there in February 2013 (when Ukip won 28 per cent of the vote) found that 55 per cent of Ukip voters mentioned immigration and/or asylum as the most important issue that determined how they had voted. This was considerably more than the 31 per cent who referred to Europe, while no other issue was mentioned by more than a handful of Ukip voters. Equally, a nationwide YouGov poll in early May found that 76 per cent were backing Ukip because they wanted to see immigration from Europe reduced, rather more than the 59 per cent who were doing so because they wanted Britain to leave the EU.4 According to another nationwide YouGov poll conducted towards the end of March, no less than 85 per cent of Ukip supporters trust their party most to deal with immigration - far exceeding the equivalent figures for other parties among their own supporters.5 At the same time, other YouGov polls have reported that while no more than 40 per cent of Ukip supporters think a party other than the Conservatives, Labour or the Liberal Democrats is the best party on such issues as the economy, NHS or education, as many as 80 per cent do so when it comes not only to Europe, but also to asylum and immigration.6
Despite the relative evenness of Ukip's performance, these patterns are still discernible in the party's local election performance. The party won just 19 per cent of the vote on average in those wards where, according to the 2011 census, over 36 per cent of the population is a graduate, but as much as 28 per cent in those wards where less than 21 per cent have completed a university education. The age balance - and even more so that of gender - does not vary dramatically from one place to another, but even so Ukip support averaged 23 per cent where less than 18 per cent are aged over 65 but 27 per cent where more than 21 per cent fall into that category.7 Meanwhile, the party performed less well in places with a more racially diverse population: the party averaged just 20 per cent of the vote in those wards where less than 90 per cent regard themselves as white.8
Who lost out?
The composition of Ukip's vote thus seems in some ways to cut across some of the traditional lines of division between Labour and the Conservatives. Ideologically, Ukip supporters appear conservative, at least with small 'c'. Yet in coming from less well educated, more working class backgrounds, they might be expected to be inclined towards Labour. It is certainly a mistake to presume that every Ukip supporter is a former Conservative attracted by what appears to be an even more conservative, Eurosceptic message than the Conservative party itself is prepared to espouse.
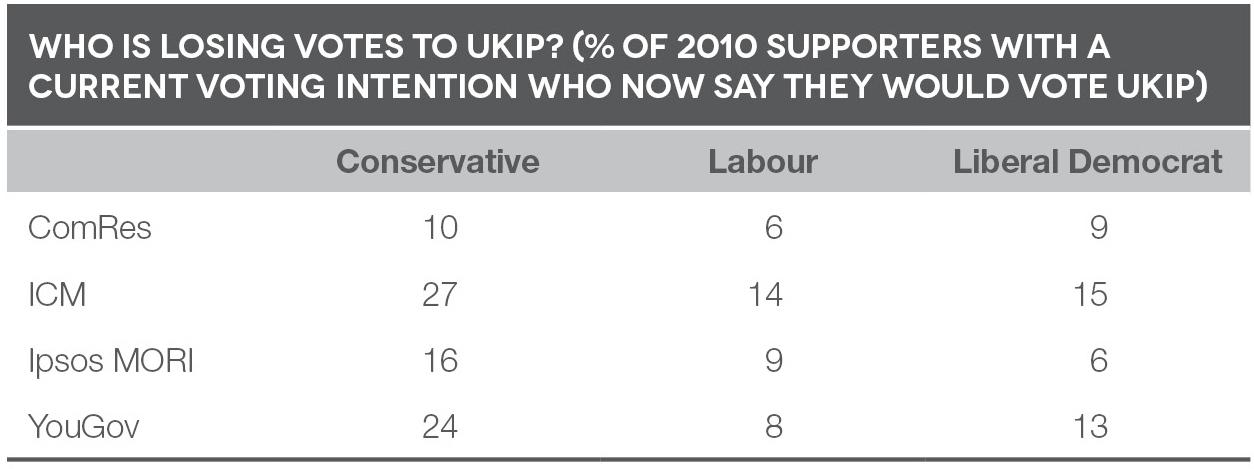
Yet it does seem clear that former Conservative voters are markedly more inclined to switch to Ukip than are those who previously backed other parties. Using the same four polls as in table 2, table 3 suggests that on average some one in five voters who backed the Conservatives in 2010 are now inclined to vote Ukip, compared with around one in 10 former Liberal Democrat or Labour supporters. In short, Ukip is indeed eating to some degree into the support of all three Westminster parties, but it is the Conservative party that is most directly in the firing line.
Table 3: Who is losing votes to Ukip? (% of 2010 supporters with a current voting intention who now say they would vote Ukip)
Again the results of the local elections are consistent with the evidence of the polls. On average, Ukip performed rather less well in those places where the Conservatives had previously been relatively weak and/or Labour had been strong: the party averaged 22 per cent of the vote in those wards where the Conservatives had won less than 30 per cent of the vote and/or Labour more than 30 per cent in 2009 (when most of the seats up for grabs had last been contested). Given also our findings on the social composition of the party's vote, this suggests that in assessing the strength of Ukip's breakthrough we should bear in mind that these elections were for the most part held in predominantly Conservative England, where relatively few of the country's younger, more diverse populations are to be found.
Meanwhile, where Ukip did especially well it was Conservative support that appeared to be hit the hardest. Where Ukip support was as much as 30 percentage points up on what (if it had stood at all) it had achieved locally in 2009, Conservative support was down on average by 15.9 points, 7.4 points more than across the country as a whole (see table 1). In the case of the Liberal Democrats, in contrast, their performance in those circumstances was typically 2.7 points worse than its average performance in general, while in the case of Labour the equivalent figure was 3.4 points.
Ukip may struggle to win seats in its own right under first-past-the-post, but this does not mean it could not still have a significant impact on the outcome of the next general election. Because it seems better able to win votes from former Conservative voters than from those of other parties, David Cameron's party faces the real risk that it will lose vital seats to Labour and the Liberal Democrats as a result of the votes lost to Ukip. It is this risk that is ensuring that Ukip's rise is already having a profound impact on the dynamics of Westminster politics as Conservative MPs try to establish how best to respond to the particular threat that Ukip appears to pose to them, albeit that so far they seem to be more inclined do so by focusing on the question of Europe than on immigration.
Conservative woe
Even without Ukip's rise, these were always likely to be relatively difficult elections for the Conservatives. When most of the county council seats had previously been fought in 2009, the party was well ahead in the polls and came a clear first in European elections that were held on the same day. Yet the party's vote was also well down on what it had been on much less auspicious occasions. As table 1 shows, the Conservative vote was as much as five points down on average on what it had been in 2005, when these county council elections were held on the same day as that year's general election - and when the Conservatives lost for the third time in a row.
More tellingly, perhaps, the party's overall share of the vote in each county was even, on average, some two points lower than it had been when the elections were held on the same day as the 1997 general election, when the party suffered its worst ever general election defeat. True, things were not quite so bad as they had been in the darkest days of John Major's administration,9 but this still counted as a relatively severe mid-term rebuff.
Liberal Democrat claims
As to the severity of the rebuff suffered by the Tories' coalition partners, the Liberal Democrats, there can be little doubt. The local and devolved elections of 2011 and 2012 had already seen the party record its worst local election performance since the 1970s, when the party last had a (small) taste of government through supporting Labour from the backbenches via the Lib-Lab pact.10 This year's performance was just as bad if not indeed worse. Across nine counties whose boundaries remain as they were in the 1980s, the party's overall share of the vote was on average as much as 8.8 points lower than it had been in the county elections of 1989, hitherto the party's previous worse performance since the 1970s and recorded at a time when the party was suffering the electoral fallout from the acrimony and division that had surrounded the merger between the Liberals and the Social Democrats.11 One has to go back to 1977 to find a consistently weaker county election performance. Indeed, in the relatively limited number of places where the result this year could be compared with the outcome in the last year's local elections, the Liberal Democrat vote was, on average, two points down even on that dismal performance.12
Liberal Democrat spokespersons comforted themselves with a claim that they had also made about their performance in the 2011 and 2012 elections, which was that their vote was holding up much better in places where they were previously strong, and especially so where there was a local Liberal Democrat MP. Consequently, they suggested, the portents for the party's ability to retain seats in 2015 were not as bad as it seemed.
The empirical evidence for this claim is, however, far from convincing. There is certainly no evidence that the party's vote held up particularly well where a council seat was being defended by an incumbent Liberal Democrat councillor. The party's vote fell on average by 12.4 points in such wards, almost exactly the same as across the country as a whole. True, at 10.6 points, the drop in the party's overall share of the vote was a little lower in places that are wholly or mostly represented by a local Liberal Democrat MP, but the difference between that figure and the overall national performance, less than two points, is not of a size to suggest that many Liberal Democrat MPs would currently be particularly well positioned to withstand the whirlwind of unpopularity that still batters the party.13
Labour flattered?
Labour, in contrast, did have real gains to celebrate. But that was hardly surprising given that the party's performance in 2009 was one of its worst ever and was followed by the resignation of three cabinet ministers and speculation about the possibility of an attempted coup against the then-prime minister, Gordon Brown. What mattered was the scale of the advance - and it was less than might be expected of an opposition that is clearly on the road to victory.
In gaining 291 seats, the party's representation in the set of councils being elected this time around remained a little below what it had been in 2005.14 More importantly, as table 1 shows, the party's share of the vote still remained well below what it had been when it had last won a general election; that the party won as many seats as it did was more a refection of the weakness of their opponents than evidence of real progress. Indeed, where the party's performance could be compared directly with what it had achieved in last year's local elections, the party's vote was on average as much as five points down, a reflection at least in part of its own share of the damage caused by Ukip's rise.
Still, much like the Liberal Democrats, Labour asserted that the party had performed well where it really mattered - in the minority of places in these elections where the party was in contention with the Conservatives, including not least in vital marginal parliamentary seats. At first glance there would appear to be considerable evidence to support this argument. In wards where the party had shared first and second place with the Conservatives its vote increased on average by no less than 11.4 points, well above its average performance in these elections as a whole. (Conversely its performance was decidedly weaker - up 6.3 points - in the many wards where the party was starting off third and thus usually had little prospect of winning.) Moreover, the party recorded an equally strong performance - an average increase of 11.5 points in the overall share of the vote - in those local authority districts that are wholly or mostly part of a parliamentary seat where Labour is breathing down the Conservatives' neck.15
However, this analysis flatters to deceive. For in the previous round of county council elections in 2009, the wards in which Labour's vote fell most heavily were precisely this kind of territory - that is, in places where the party was in contention with the Conservatives. All that Labour managed this time around was to reverse that particularly severe decline. If we compare Labour's performance in key Conservative/Labour battlegrounds this time with what happened in 2005, Labour's performance proves not to have been particularly strong at all. In the average ward where Labour shared first and second place with the Conservatives in 2005, Labour's vote was still down on its tally eight years ago by 5.9 points, a somewhat bigger deficit than across all wards (4.7 points). Meanwhile, on average, the party's share of the overall vote in those districts that wholly or mostly fall within a Conservative/Labour marginal was exactly in line with the average drop in the party's vote across all wards.
In short, Labour's own vote remained well short of what it had been in 2005 in the key Conservative/Labour battlegrounds, and if they won most votes in such places doing so was the product of Conservative decline rather than Labour advance.
Conclusion
Of course, it remains to be seen whether Ukip will seize the opportunity its success in these local elections has afforded it to develop the organisational roots and political credibility required to become a major party. In the short term, the party looks set to do well in next year's European elections - these occasions have already shown that they provide the party with a happy hunting ground (though Ukip may well find appealing to the relatively young and ethnically diverse population of London in the capital's borough elections next year rather more of a challenge). On the other hand, sustaining its support in a UK general election, when voters are more inclined to choose than protest, will doubtless prove rather more of a challenge, while the electoral system will treat the party's geographically evenly spread vote with its usual harshness.
Yet the party's success in the 2013 local elections - and in polls and by-elections during the course of the previous 12 months - cannot simply be dismissed as self-evidently a mid-term flash in the pan. It comes on the back of a growing willingness of voters to vote for parties other than the three main parties at Westminster, a willingness that resulted in a record share of the vote for such parties in 2010.16 In part, Ukip's success is a reflection of the fact that now the Liberal Democrats are a party of government, and manifestly continue to be an unpopular one at that, and so are no longer available as a vehicle of protest - and that while Labour proved able to attract disaffected Liberal Democrats earlier in this parliament it has more recently proved unable to reach across to discontented Conservatives. Meanwhile, Ukip's central message - that getting out of the EU is the only way to control immigration at a time of continued economic austerity - gives it a unique selling proposition that none of the Westminster parties can match, and enables the party to feed off the apparent failure, underlined by the local elections, of all three main Westminster parties to enthuse the electorate.
In any event, Ukip's influence and impact rests not on its own ability to win votes and seats, but to deny them to others - above all, the Conservative party. Even before the local elections, Ukip's rise had already persuaded the prime minister, David Cameron, to offer the prospect of an 'in/out' referendum following a renegotiated deal with Europe. The local results themselves have seen Tory MPs wanting to pursue that commitment further still, albeit that there no immediate signs of such steps curbing Ukip's rise. Meanwhile Labour and the Liberal Democrats too will eventually have to decide how to respond to a threat to their own prospects that they cannot simply ignore.
At minimum it seems that Ukip have already achieved enough to ensure that Britain will remain in the slowest possible European lane for the foreseeable future. Meanwhile, its key demand - that there should be a referendum on Britain's continued membership of the EU - could conceivably come to pass in some form or other without a single Ukip MP ever being elected at Westminster. And given the persistently Eurosceptic mood of the British public, nobody can be sure what the outcome of such a ballot would prove to be.17 These local elections could well have profound long-term international consequences.
The article appears in issue 20(1) of Juncture, IPPR's journal for rethinking the centre-left.
Notes
1. See Heath A, McLean I, Taylor B and Curtice J (1999) 'Between First and Second Order: a Comparison of Voting Behaviour in European and Local Elections in Britain', European Journal of Political Research, 35: 389-414. ^back
2. That is, belonging to the C2DE occupational social grouping. ^back
3. See Ford R, Morrell G and Heath A (2012) 'Fewer but better? Public views about immigration', in Park A, Clery E, Curtice J, Phillips M and Utting D (eds) British Social Attitudes: the 29th report, London: NatCen Social Research; Blinder S (2011) UK Public Opinion towards Migration: Determinants of Attitudes, Oxford: Migration Observatory; Ross A and Sacker A (2010) 'Understanding the dynamics of attitude change', in Park A, Curtice J, Thomson K, Phillips M, Clery E and Butt S (eds) British Social Attitudes: the 26th report, London: Sage. ^back
4. YouGov, 1-2 March 2013. ^back
5. YouGov, 25-26 March 2013. ^back
6. See for example YouGov poll 28-29 April 2013. This and similar YouGov polls do not give details of which 'Other' party these Ukip supporters name as best, but it would seem safe to presume that they will for the most part have mentioned Ukip. ^back
7. Support was also higher on average in places where a relatively large proportion of the population are not in good health, a phenomenon that is in part a reflection of social deprivation but also of age. ^back
8. On its own the proportion of residents born in the EU was not clearly related to the level of Ukip support, although it does become so in a multivariate analysis that takes into account a range of other demographic characteristics, including those related to age, education and ethnic diversity. This suggests that on its own the level of immigration from the EU locally was not a particularly strong trigger for Ukip support, but only had such an impact where the existing population was less likely to be tolerant towards new arrivals. ^back
9. This comment is based on comparing the Conservative share of the vote in 2013 with that in the district council elections of 1995 in those districts where local elections are fought primarily on a partisan basis. On average across 96 districts where this comparison can be made, the Conservative vote was 4.6 points higher in 2013 than it was in 1995. ^back
10. Curtice J (2011) 'A return to two party politics? Lessons of the 2011 Local and Devolved Elections', Public Policy Research, 18(2): 88-96. ^back
11. The composition of many counties has been changed since the 1980s through the removal from them of one or more unitary council areas covering an urban centre. In these cases, comparison of the district level outcome in 2013 with that in 1989 confirms the scale of the fall reported here for the unchanged counties. ^back
12. The wards (strictly speaking, electoral divisions) used in county council elections are different and often cut across the wards used in local district council elections, while in many places where elections where held this year no election was held last year. The figure quoted here is based on the outcome in 123 places where the boundary of an electoral division is aligned with that of one or more wards and where an election was held throughout in 2012. This includes some instances in the unitary council of Bristol where, exceptionally, elections had also been held in 2012. ^back
13. Assessing the validity of the Liberal Democrats' claim is made difficult by the fact that the boundaries of the wards used in county council elections often cut across the boundaries of parliamentary constituencies (see note 12). The figure here is based on the Liberal Democrats' overall share of the vote in nine district council areas which are wholly or mostly represented by a Liberal Democrat MP and where the party fought all of the component divisions in both 2009 and 2013. ^back
14. Labour won 564 seats on these councils in 2005, though the comparison is affected a little by changes since then in the number of seats on some councils. ^back
15. Defined as constituencies where the Conservative lead over a second-placed Labour candidate was less than 15 per cent in 2010. As noted at note 12, the boundaries of county electoral divisions do not necessarily match those of parliamentary constituencies, thereby making exact calculation of the parties' performances in many parliamentary constituencies impossible. ^back
16. Curtice J, Fisher S and Ford R (2010) 'Appendix 2: An Analysis of the Results', in Kavanagh D and Cowley P, The British General Election of 2010, Basingstoke: Palgrave Macmillan. ^back
17. Curtice J (2013) National Identity and Constitutional Change, London: Government Office for Science.^back
Related items

The legitimacy trap
Why a more active state needs better statecraft.
On home ground: The future of devolution
Andy Burnham has pledged to deliver “the biggest rebalancing of power the country has ever seen”. The key task for the new government is putting this into action.
The first 100 days: A blueprint for renewal
The choices that the new prime minister, Andy Burnham, makes in the first 100 days must demonstrate that he is on the side of ordinary people.