Article
Thomas Piketty's Capital in the Twenty-First Century argues, with great persuasiveness, for the historical centrality of personal wealth at the top of the distribution– its accumulation, composition, inheritance, concentration, taxation and destruction. At the core of the book are (a) a theory – a set of interlocking models – of wealth dynamics over time and (b) an extensive documentation of trends in personal wealth from the early 19th century to the present day, with particularly detailed analysis of the remarkable inheritance data for France from 1820 on. The theory is elegant, but it is the confrontation of the theory with history that makes Capital at its best uniquely illuminating and unsettling.
The conclusion is by now well-known: the dynamics of wealth accumulation are generally disequalising, and the major deconcentration of wealth in the short 20th century (1914–89) was due to contingent historical factors which have now run their course or gone into reverse. Without policy interventions we should therefore expect wealth inequality to increase, not in an open-ended manner, but in a way that will eventually undo much of the equalisation of the last century.
There's a lot more to the book, with chapters on income inequality and the prospects for the welfare state for example. Piketty is too good an economist and writer not to have interesting things to say on these subjects, but what he has to say on other themes is not always strongly integrated with what I've called the 'core' of the book.
This is potentially a problem when it comes to the diffusion of the book's messages. It's important to bear in mind that Capital is mainly about wealth, not income, and mainly about wealth at the top at that. It does not offer a comprehensive theory or history of economic inequality, and some of the negative reaction to the book – even some of the positive reaction, one suspects – stems from this not being well understood. A focus on wealth at the top is certainly in-keeping with the post-crash zeitgeist, but the top 1 per cent wealth share is not a statistic from which we can read off inequality more generally.
This raises the question of why the top share of wealth is important. Historically, analysis of the individual distribution of income and wealth has tended to be motivated by concerns with welfare (using 'welfare' loosely as a placeholder for utility, resources, capabilities and other currencies of mainstream egalitarian theory). Top wealth shares engage different motivations: Piketty stresses the convertibility of extreme wealth into power and the inheritance of elite social positions. Even if (implausibly) we had no reason to fear that the emergence of a concentrated elite of super-wealthy inheritors would be bad for social welfare or inequality more generally, it could still be seen as inconsistent with democratic norms. Thus concern with the super-rich is more to do with republican ideals of political equality than with welfare. It's important not to get the two mixed up – as John Rentoul, for one, seems to do when he glibly summarises Piketty's message as 'apocalyptic visions of a return to Dickensian social division'.
Another potential source of confusion regarding Capital's message is that, persuasive as the grand narrative is, it is not clear where exactly within that narrative we are now. Are we definitively on the upward slope of the predicted U-shaped curve of wealth inequality? Much of the reaction to the book seems to assume that this must be true – and obviously true at that – if Piketty's theory is to stand up, but I don't see why this should be the case. The curves that Piketty shows for top wealth shares in France, the UK, the US and Sweden certainly do not look U-shaped yet. What they show is that the period of falling top shares came to an end a long time ago (around 1970 for the European countries and around 1940 in the US).
Increases since then are relatively modest by comparison to the major deconcentration of wealth in the last century. They may mean we are at the foothills of a long-term upward trend, but neither the theory nor the empirical evidence to date tell us much about this (though I will return to this point). Absent wars and other 'exogenous shocks', the evolution of top shares is long-term in nature, driven by savings, bequests and intrafamily transfers over generations. The celebrated inequality r > g (the rate of return on capital exceeds the growth rate of the economy) tends to accelerate the process of concentration, and this provides a link between wealth concentration, wealth accumulation and the capital share of income. (There is also an important but less remarked-upon formula linking the capital:income ratio, mortality and wealth at time of death to the flow of inheritance.) But the interlocking models of the theory do not lead to a prediction as to when we should expect to see rising top shares, or of the precise rate at which they would be expected to rise.
Commentators who leapt on this month's findings from the UK Wealth and Assets Survey to dismiss Piketty's theory – such as Rentoul and Kitty Ussher – are therefore missing the point. For what it's worth, the survey shows no particular trend in inequality of wealth between 2006/08 and 2010/12 as measured by a Gini coefficient (which, given the presence of large amounts of negative wealth, which the Gini is not well-designed to cope with, is even less informative than usual). It shows a modest increase in the top 10 per cent share. Piketty's data, using a very different definition of wealth (excluding most pensions) and different underlying data (estates records) shows a modest rise in the top 10 per cent and top 1 per cent shares between 2000 and 2010. Even if this short-term data were crucial to Piketty's long-run argument, there is not much to argue about here.
Ussher nonetheless writes: 'Thomas Piketty, in his much-cited recent book on the distribution of wealth, argues that because the return on capital is greater than the long-term growth rate, wealth must by definition become increasingly concentrated in fewer hands. But today's data on the wealth and assets survey from the Office of National Statistics gives little evidence to support that view in Britain. If you take a 100-year view, Piketty is clearly wrong. One in five people in the early 20th century owned property; today two thirds do.'
It is hard to see how anyone who has read Capital, or even one of the better-informed reviews of the book, could write this. The deconcentration of wealth ownership in the 20th century is the great theme of Capital. Piketty documents the fall in the top 10 per cent and 1 per cent shares in wealth and explains how it came about, showing the roles played by war, inflation, taxation, rapid economic growth, the rise of a property-owning middle class and (in one of many new insights in the book) decolonisation in making the persistently unequal distribution of wealth somewhat more equal. A section of chapter 10 – the one with the giveaway heading 'Why inequality of wealth has not returned to the levels of the past' – is devoted to reasons why we should not expect the process of wealth reconcentration to be particularly rapid. To say 'Piketty is wrong' on the basis of precisely the sort of evidence he cites indicates an elementary misunderstanding.
It is important to recognise that Piketty's slogan 'capital is back' does not imply any particular level of wealth concentration. 'Capital is back' refers to the ratio of the capital stock to national income (represented by the Greek letter ??) and to the share of capital income in national income (represented by ??). These variables have indeed returned to or exceeded early 20th century levels, but this tells us precisely nothing about current inequality of capital ownership. To clarify all this, I've tabulated Piketty's data for these variables for the UK (downloaded from his amazing website).
Figure 1: Capital21C series for the UK
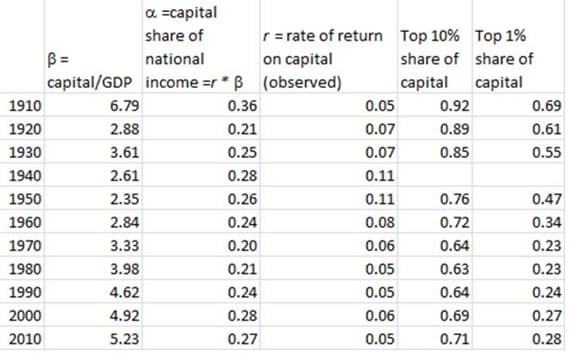
?? is at its highest level since some time before 1920, ?? since 1940. (By definition, ?? is ?? times r, the rate of return on capital; in 1940, for example, the capital stock measured in terms of national income was very low while r was very high, while in 2000 the rate of return was lower but ?? was nearly twice as high, leading to identical ?? in both years.) As can be seen, top wealth shares are nowhere near their early 20th century levels.
U-shaped curves that seem to show that history is reversing are all the rage at the moment (I've done one myself, for the top 1 per cent income share). Income, the capital:income ratio and the capital share of income all show this sort of pattern to differing extents for the UK. Wealth concentration in the UK and other countries may come to show a similar trajectory over time, and Piketty has given us strong reasons for thinking that this is likely to happen without policy action. Capital offers a warning, based on extensive historical documentation and theoretical analysis. Nothing in the Wealth and Asset Survey gives us any reason to dismiss that warning.
Finally it's worth noting that things have moved on even since Capital, with new (but preliminary) data from Saez and Zucman bringing the very top of the US distribution into sharp focus. If you want a U-shaped curve for the top wealth share, this is where to look. But it's not for the top 10 per cent or even the top 1 per cent: it's for the top 0.1 per cent.
Figure 2: Back to the roaring 1920s
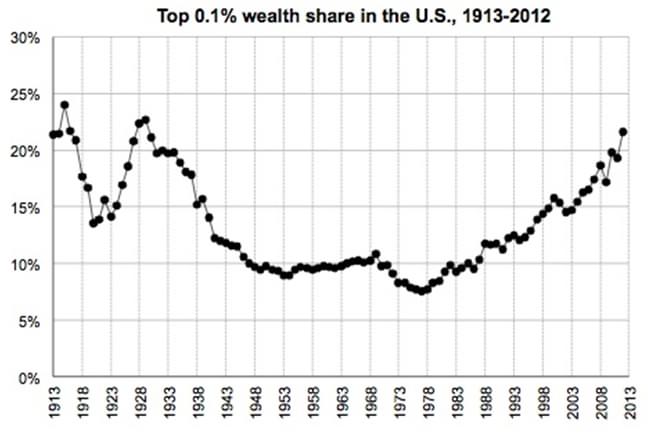
Source: Saez E and Zuchman G (2014) 'The Distribution of US Wealth, Capital Income and Returns since 1913'
The minimum (NB: not the average) wealth for people in the top 0.1 per cent today is $20 million. Note that it took the 0.1 per cent share 35 years to crawl back to its 'roaring twenties' level from its low point in 1978. Saez and Zucman show that it is only at the very top of the distribution that wealth inequality is increasing in the US. Indeed, even among the top 0.1 per cent, the top 0.01 per cent now have more than half the wealth (and Brad DeLong calculates their average wealth at $263 million). Meanwhile, the wealth share of those Saez and Zucman refer to as the 'merely rich' – the top 1 per cent excluding the top 0.1 per cent, with wealth of $4–20 million – has been more or less stuck at a mere 16–18 per cent or so of total wealth since the '70s, while the 'middle rich' – the top 10 per cent excluding the top 1 per cent, with wealth ranging from $500,000 to $4 million – have seen their share fall from 45 per cent to 35 per cent over roughly the same period.
It's impossible to say at this stage whether this process of reconcentration of wealth at the very top in the US is remotely similar to what has been happening anywhere else (there is no long-term data above the top 1 per cent share for the UK, for example). It's also worth noting, as Piketty stresses in the book, that until the middle of the last century, wealth concentration in the US was substantially lower than in European countries. Nonetheless, the 35-year upward trend of the top 0.1 per cent share in the US is at least preliminary evidence that the sort of long-term dynamic of wealth concentration Piketty has proposed for the 21st century is not just a theoretical construct. Moreover, the fact that this reconcentration has occurred at the 0.1 per cent and 0.01 per cent levels is disturbingly consistent with the theory.
Whether the r > g inequality is amplifying the reconcentration trend is a different question: Saez and Zucman's data for the average post-tax rate of return between 1990 and 2012 indicates r was indeed higher than g over that period, by about a percentage point. But as Piketty scrupulously notes in his book, some downward adjustment to observed rates of return is needed to take account of 'the labour, or at any rate attention, that is required of anyone who wishes to invest' so how much we should make of this is a moot point.
What is important is that we now have a framework for thinking about the sort of pattern revealed in this data. No doubt that framework will be modified over time in the light of new evidence and theory, but it seems likely that we will be looking at wealth concentration and broader aspects of economic and social change through the lens of Capital for a long time to come.
Related items

The legitimacy trap
Why a more active state needs better statecraft.
On home ground: The future of devolution
Andy Burnham has pledged to deliver “the biggest rebalancing of power the country has ever seen”. The key task for the new government is putting this into action.
The first 100 days: A blueprint for renewal
The choices that the new prime minister, Andy Burnham, makes in the first 100 days must demonstrate that he is on the side of ordinary people.