Article
After the dust of the campaign has settled, the most important question for the new Labour leader will be how to make inroads into the Conservative government’s majority. How the party does this depends on a correct assessment of what went wrong in the general election in May. In this article we highlight six reasons we currently believe to be the most important, based on preliminary analysis of British Election Study data. Some of the most frequently cited reasons – such as Labour being too left-wing and the threat of the SNP – are not on our current list, and we will conclude by discussing why this is the case.
Problem 1: The 2007/08 economic crash
It is well-known that by the time of the election Labour’s ratings on the economy trailed the Conservatives’, inflation rates had begun to decline, and the Conservatives were being rewarded for their handling of the economy. Figure 1 (using Ipsos MORI data from 1990–2015 on the ‘best party on the economy’ alongside vote intention) puts this into perspective. Some events realign parties with crucial issues. The economic crash in 2007/08 appears to have done for Labour what the exchange rate mechanism crisis did for the Conservatives more than 20 years earlier: it fundamentally altered the public perception of which party could be trusted on the economy. Given how long it took the Conservatives to recover a lead, it must be questionable whether Labour could have undone this shock to its ratings between 2010 and 2015.
What is more, an important change occurred from 2013 onwards: the gap between trust in Labour and the Conservatives on the economy widened, and substantially so. Further research is needed to understand what caused this – but interestingly, perceptions of Conservative economic competence increased before the economic upturn actually arrived (as measured by major economic growth indicators).
Figure 1
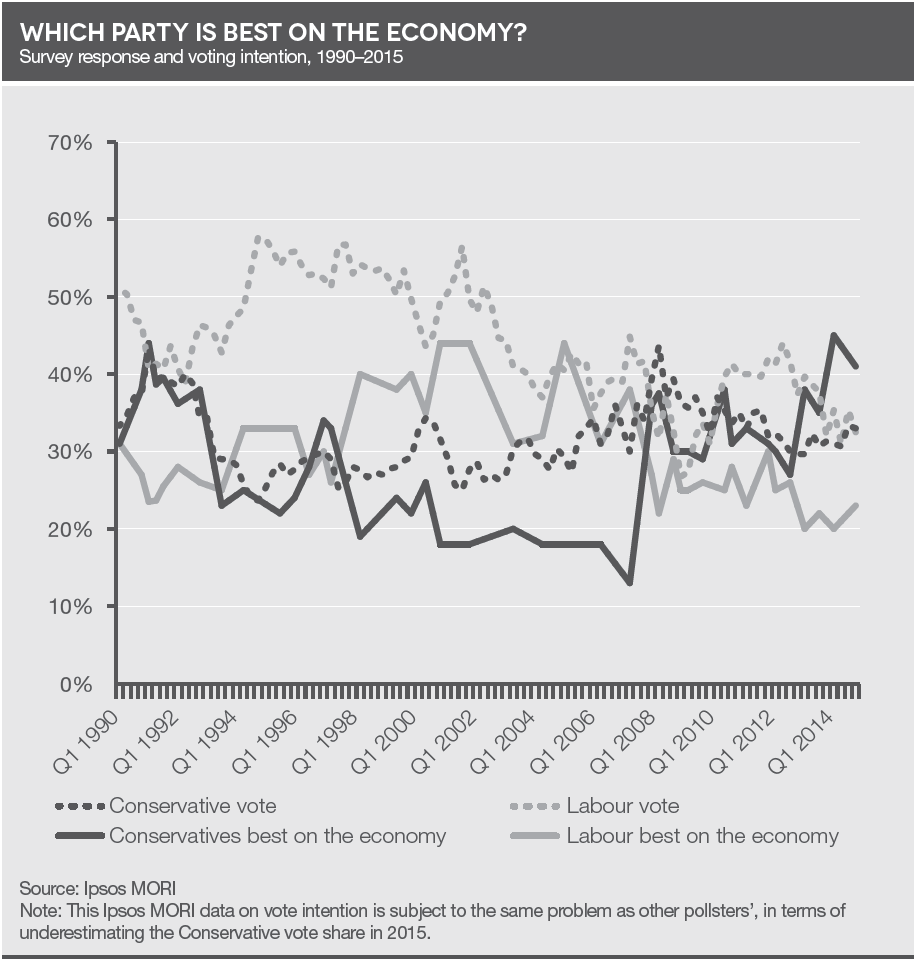
Another slightly less obvious aspect of the economic problem for Labour was that by 2015 many voters were still blaming Labour for a sluggish economy. If they saw an improvement in the economy, they gave credit to the Conservatives. But Labour received no credit, only a share of the blame.
This pattern wasn’t unique to the economy. The 2014/15 British Election Study surveys reveals the same phenomenon in areas such as cost of living, the NHS, education, crime and immigration. People who thought things were going well gave very little credit to Labour, while those who thought things were going badly gave Labour at least some of the blame. We cannot tell whether this is unique to Labour in opposition (our BES surveys are the first to ask these questions in these formats) but the fact that this sort of judgment was not confined to questions of the economy suggest this was an intrinsic problem for Labour not affected by political strategies (or their lack) on different issues.
Our data also shows that while people blamed the banks and global financial institutions for the level of UK debt, they blamed Labour too. By blaming external actors, Labour couldn’t escape blame for its actions taken when it was in power.
Problem 2: Prime ministerial competence
The other obvious problem for Labour was leadership. It is not necessary to highlight once again the gap in public assessments of Ed Miliband and David Cameron as the better prime minister, although there are a few useful caveats to be added to the usual discussion.
As the following graph suggests, by the three-and-a-half-week mark of the general election campaign, Miliband was seen as having a more successful campaign than Cameron, perhaps against low expectations. This rating of who ‘performed best in the campaign’ switched in Cameron’s favour shortly before the election, as figure 2 shows. In neither case was this reflected in like/dislike ratings for the leaders.
Figure 2
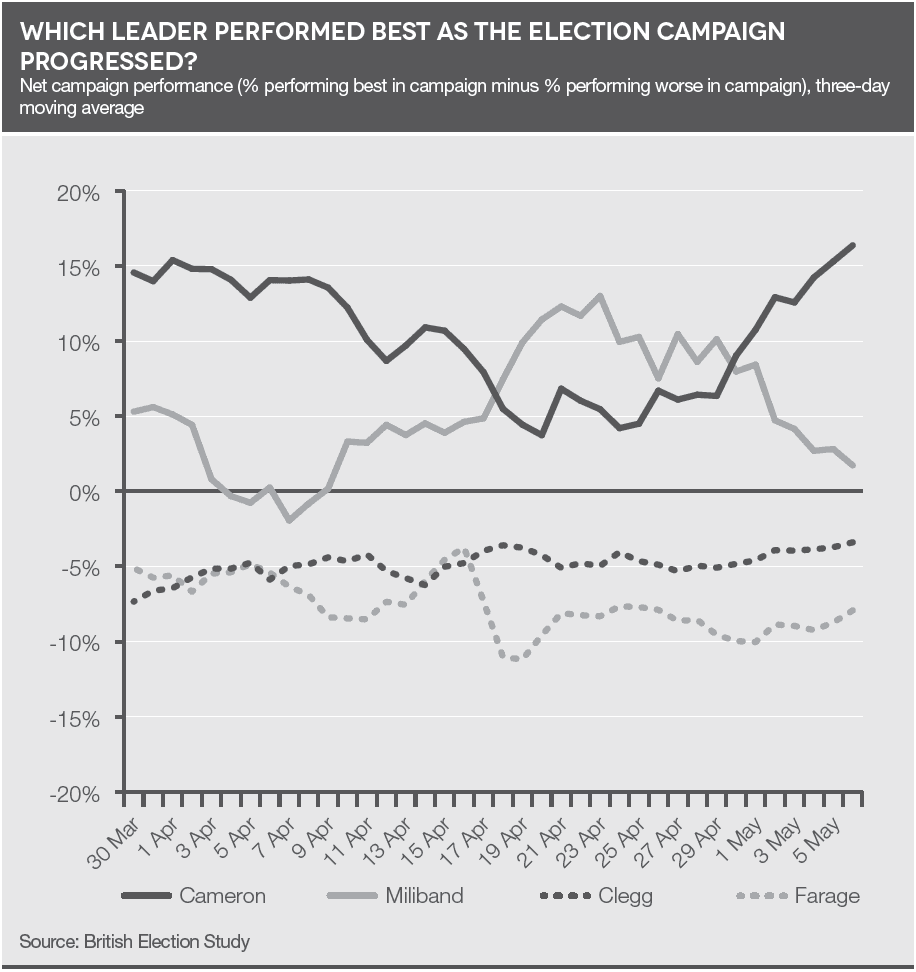
The second caveat is that none of the leaders was well-liked (except the SNP’s Nicola Sturgeon within Scotland). Cameron was less disliked than Miliband, but still disliked on average.
The third caveat draws on research by BES colleagues Geoff Evans and Jon Mellon, who find that the net effects of Miliband’s ratings (the difference between effects in terms of vote gains and vote losses) were not negative, but that Miliband accounted for fewer vote gains and more vote losses than the other party leaders did for their parties. Furthermore, and interestingly, the negative effects of Miliband’s ratings were not related to Labour’s left–right position.
Problem 3: Scotland
There is great deal more to be done to understand the unravelling of Labour support in Scotland and its transmission to the SNP. However, research by BES colleague Ed Fieldhouse (with Chris Prosser) reveals that Labour voters were more likely to vote ‘yes’ in the independence campaign when: (i) they believed that Scotland would be better off under independence; (ii) they approved of the SNP government in Scotland; and (iii) they were dissatisfied with UK democracy. Additionally, the more left-wing they saw themselves as, and the more right-wing they saw Labour as, the more likely they were to vote for independence.
The independence referendum resulted in a seismic change in vote intentions, with former-Labour yes voters decamping to the SNP. The BES reveals two points that suggest that Labour will have a very difficult time recapturing its lost voters in Scotland. First, Labour-to-SNP switching was not just about the referendum – even controlling for referendum vote, how much Labour voters said they liked Labour and the SNP four months before the referendum predicts how likely they were to switch to the SNP after the referendum. The referendum provided a rallying point for voters who were already dissatisfied with Labour. Second, the aftermath of the referendum is almost as important as the referendum itself. Of those who switched from Labour in May 2014 to the SNP in May 2015, 40 per cent were still intending to vote Labour just after the referendum in September.
Problem 4: Labour’s gains from the Liberal Democrats
We have to emphasise and then re-emphasise that Labour gained support in 2015. In an election in which a party won a substantial increase in support, it is necessary to drill down to why that support didn’t win the party seats. Why did Labour increase its vote share in England by 3.6 per cent and see a net gain of 15 seats, while the Conservatives increased their vote share in England by 1.4 per cent yet gained 21?
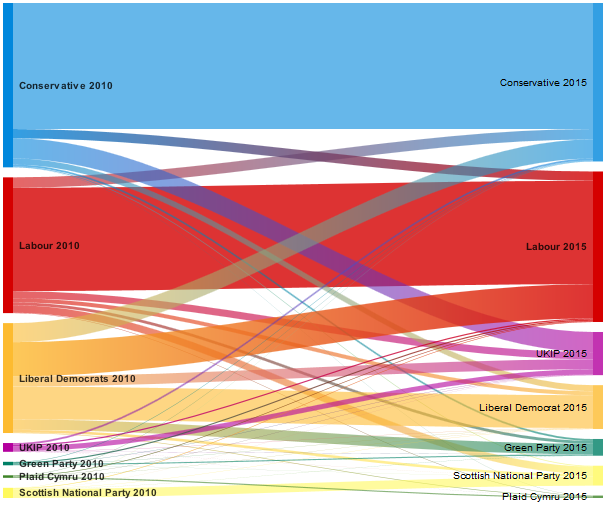
To understand Labour’s gains better, figure 3 shows the inflow to and outflow from each party between 2010 and 2015 (post-election data). Note that this data has not yet been corrected for the overestimation of Labour support, while further investigations are completed.
There is a lot of detail to digest in this chart, but three points are important to note. The first is that the Conservative-to-Labour flow is roughly equal to the Labour-to-Conservative flow. So we need to better understand where Labour and the Conservatives won and lost support from other parties in order to understand the overall outcome. The second point to note is the much greater successes Labour had among former Lib-Dem voters compared to the Conservatives: Labour won about the same proportion of former Lib-Dems as the Conservatives, Greens and Ukip put together. The third is that the Conservatives lost much more support to Ukip than Labour did.
Figure 3
VOTE FLOWS BETWEEN 2010 AND 2015
How could Labour be the largest beneficiary of the collapse of the Lib Dems in terms of votes, and not translate those new votes into more seats? (Some ‘phantom support’ may have arisen among people who overstated the likelihood of their voting in 2015, but that can only account for a small degree.)
In Lib-Dem seats, two major factors were at play. First, the Conservatives were the second party in two-thirds of Lib-Dem seats, and these were the most vulnerable. Second, and relatedly, Labour’s gains in taking votes away from the Lib Dems helped secure Conservative victories against the Lib Dems in these vulnerable seats. That is to say, it was Labour’s vote gains that helped to deprive Labour of an overall majority or largest party status. There was a tactical unwind that cost the Liberal Democrats seats but delivered those seats to the Conservatives.
Examining in greater detail those seats which switched from Lib Dem to Conservative, of the votes the Lib Dems lost, around 43 per cent went to Labour and 31 per cent to the Conservatives. We estimate (using calculations of vote change in these seats) that the gains by Labour from former Lib-Dem voters alone delivered seven former Lib-Dem seats to the Conservatives. This tactical unwind will obviously have made a contribution in a larger number of seats also. Simplistically, Labour needs to lose votes to the Lib-Dems to cut into the Conservative majority, or it needs to defeat the Conservatives in seats where it was previously not in contention.
Problem 5: Conservative–Labour battlegrounds
The following set of charts shows how votes moved between the start of the election campaign in March 2015 and our post-election data in June. Figure 4 shows the flow of votes between each party and the Conservatives in Conservative–Labour marginals (where the 2010 Conservative lead over Labour was less than 10 per cent) – that is, seats held by the Conservatives and under challenge from Labour. Figure 5 shows the same between each party and Labour. Positive bars denote vote gains from the noted party (that is, for the Conservatives/Labour respectively), and negative bars denote losses to the noted party (from the Conservatives/Labour respectively). For comparability the figures are based on estimated percentages of the eligible electorate. Comparing these two figures, it is clear that the Conservatives did much better in attracting Ukip voters over the course of the campaign than Labour did in Con–Lab marginals, and also that the Conservatives did better than Labour in winning over former Lib Dems in these seats.
Figure 4
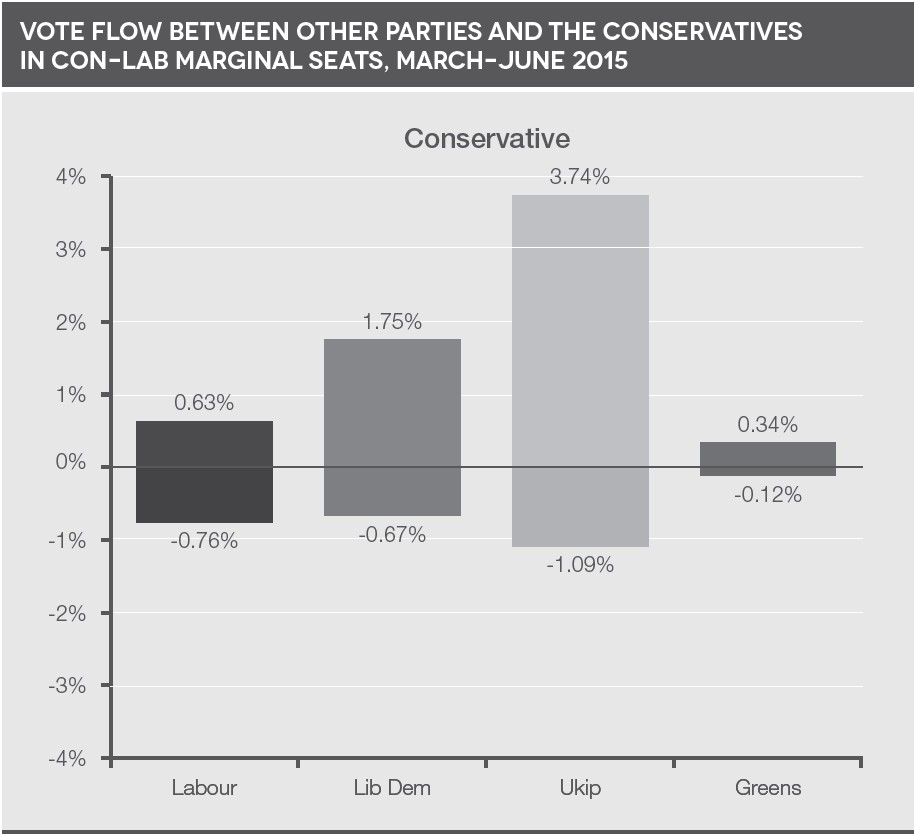
Figure 5
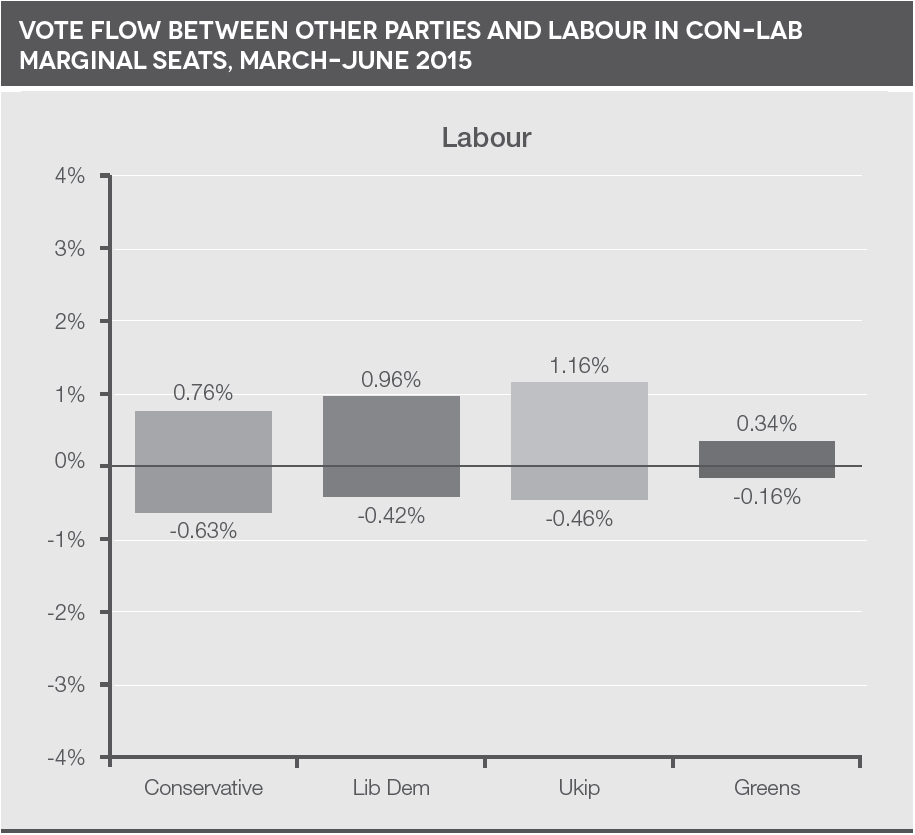
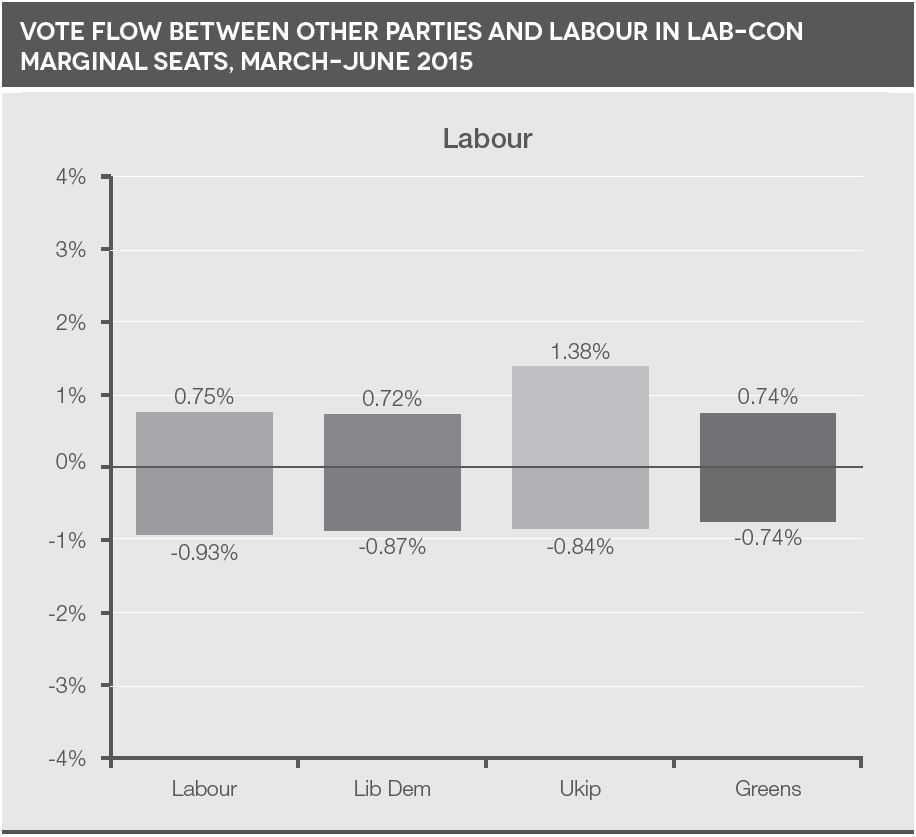
The following figures display the same flows before and after the campaign in Labour–Conservative marginals – that is, seats Labour needed to hold from a Conservative advance. Worryingly for Labour, the Conservatives outperformed Labour in these seats as well, although not nearly to the same degree as they did in Conservative-held seats. Note the Conservative gains among Green voters.
Figure 6
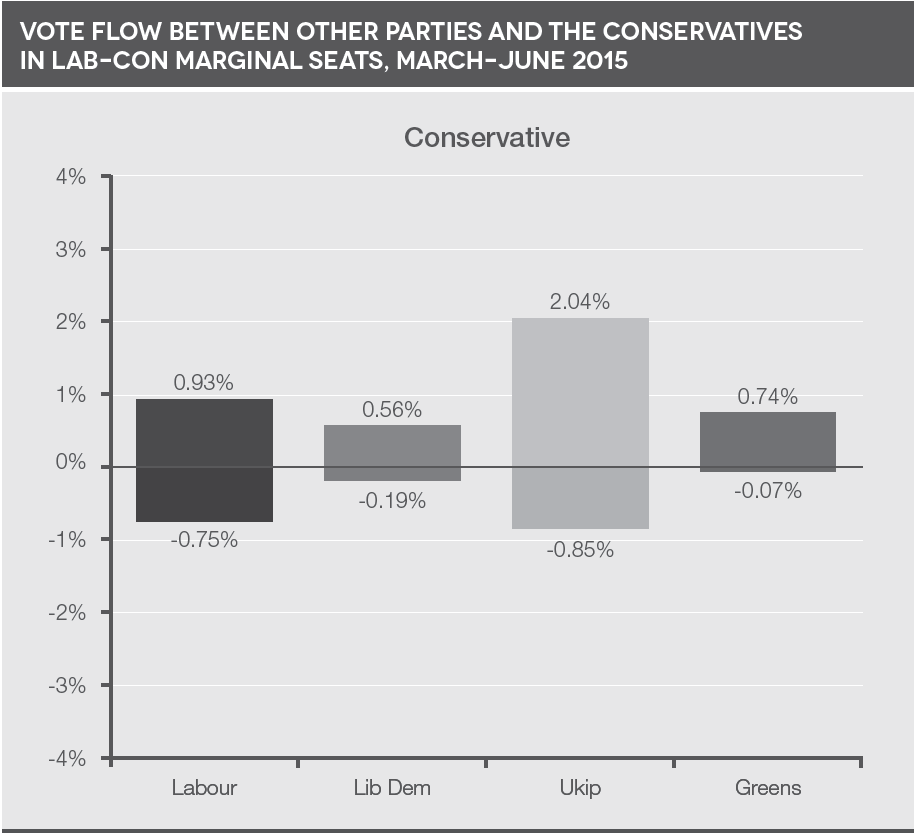
Figure 7
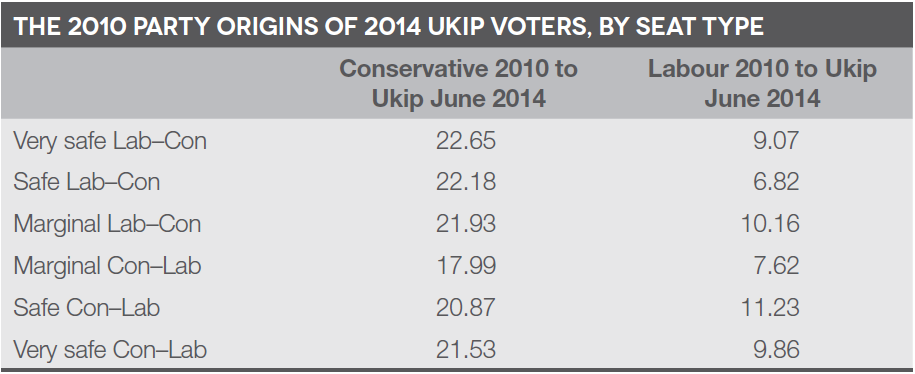
One explanation for the Conservatives’ greater success among Ukip voters may be that there were always more notional Conservative voters in these seats to begin with: many people said they would leave the Conservatives to support Ukip, but those voters returned to the Conservatives to defeat (or hold off) Labour candidates. It is possible that this was always going to happen: the majority of Ukip voters are former Conservatives rather than former Labour voters, and a tactical vote for the Tories in these marginal seats makes sense for a Ukip voter who would naturally rather end up with a Conservative MP than a Labour one. Examining the political preferences of the Ukip-to-Conservative voters in our data, we find that the Conservatives should have been able to win back these Ukip voters at a rate of roughly two to one compared with Labour (in Con–Lab and Lab–Con marginal alike) on the basis of this political hinterland alone. However, figures 4 and 5 suggest that the Conservatives were winning over Ukip voters at a rate of around three to one compared with Labour, at least during the campaign, which suggests there was a pull factor we need to explain.
Table 1
The question of why former Lib-Dem voters shifted allegiance to the Conservatives in cases where they could have voted for and elected a Labour MP is more puzzling. Among 2010 Lib-Dem voters in our sample, 7 per cent were former Tories and 25 per cent were former Labour voters. There should have been a much greater potential Lib-Dem-to-Labour switch than Lib-Dem-to-Conservative (at least if we look at the campaign). We need to better understand what motivated these voters.
Our analysis (using statistical models of vote choices) suggests that 2010 Liberal Democrats were likely to switch to the Conservatives when they disliked Ed Miliband; when they believed that the Conservatives were responsible for recovery in the economy; when they did not credit the Liberal Democrats with a role in the economic recovery; when they did not think the banks were responsible for the level of government debt; and when they thought that immigration levels should be decreased a lot. The results also suggest that Labour may have benefitted from some tactical voting among former Lib Dems, and also from the view that ‘politicians only care about people with money’ – that’s to say, Labour’s appeal against big business and commercial interests among Lib Dems might have helped to stave off worse losses.
Those who voted Ukip at the 2014 European parliament elections were most likely to vote Conservative in 2015 when they liked David Cameron; they were more likely to vote Labour when they liked Ed Miliband and did not think the Conservatives were responsible for the economic recovery. Labour appears to have suffered from some strategic voting among these voters if they thought the Conservatives could win and they liked the Tories. There was no apparent direct effect of immigration attitudes on Labour’s vote among former Ukip voters, nor of a perception that Labour was on the side of working people (or otherwise).
Our findings currently suggest that it was perceptions of responsibility for the economy and leadership which were important drivers of Lib-Dem voters moving to the Conservatives rather than Labour, and of Ukip voters going back to the Conservatives. We cannot detect an effect, as yet, for the perception that the SNP would have influence in the UK government or the belief that there would be a hung parliament – points we will return to.
Problem 6: Labour’s gains among non-voters
BES colleagues Jon Mellon and Chris Prosser argue that a large part of the 2015 polling miss can be explained by an increase in support for Labour among people who were likely to overstate their intention to vote and who had previously supported the Liberal Democrats. These people are younger and less affluent. The BES in-person probability survey will shed light on these investigations, but for now BES research seems to suggest that one of the problems for Labour in 2015 was that a proportion of potential voters did not get to the polls. We think it is very likely that many of these voters were never going to vote, irrespective of the party’s efforts, but it certainly seems the case that part of Labour’s problem was that it increased its support among non-voters.
A pair of red herrings: the SNP, and left–right ideology
There are two oft-cited reasons for Labour’s failure that we do not address here, because we currently think those explanations might be red herrings, at least in the main.
The first is the ‘SNP threat’. As discussed above, we currently find little robust evidence that attitudes towards the SNP and expectations about a hung parliament resulted in gains for the Conservatives from Ukip or in vote losses for Labour from former Lib Dems. We cannot say for sure that this didn’t matter, but our explorations suggest it is a difficult effect to pin down. We find much clearer and more robust evidence that perceptions that there was going to be a hung parliament enhanced votes for ‘challenger parties’ overall: Ukip, Plaid Cymru, the Greens, the Lib Dems and the SNP. This might have cost Labour votes, but not in the ways people may assume.
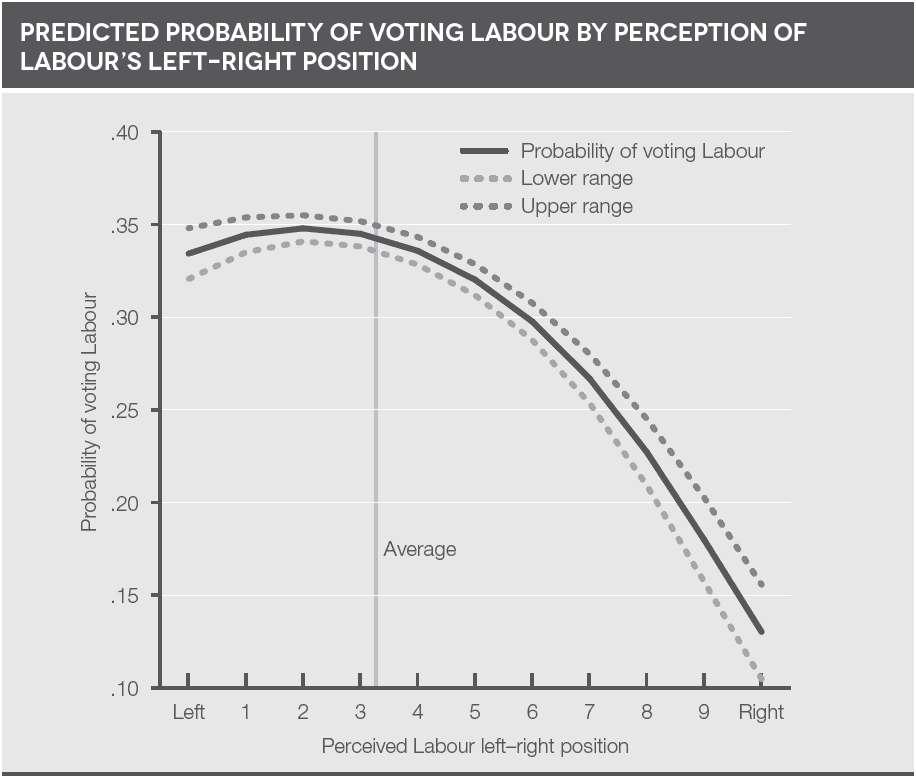
The second red herring is Labour’s left–right position – that is, the question of whether Labour was either overly or insufficiently left-wing. Generally, our data shows that people were more likely to vote Labour in 2015 when they thought the party was more left-wing, and less likely to vote Labour when they thought it was centrist. Figure 8 shows the ‘predicted probabilities’ of voting Labour based on a statistical model of BES respondents’ positioning of Labour on a left–right scale. The respondents who were most likely to vote Labour were those who saw Labour as sitting on the left of the political spectrum, with the absolute peak coming in at around 2 on this 0–10 scale – slightly to the left of where respondents placed the party on average (the vertical line). This suggests there is very little to the argument that Labour was too left-wing to attract voters. At the same time there is not much to support the argument that Labour was not left-wing enough. There was very little difference in the likelihood of voting Labour between someone who thought Labour sat at the left-most end of the scale (0) and someone who saw it as just left of centre (4) – it is only when people saw Labour as sitting to the right of this point that support really drops off.
Figure 8
There are three points to bear in mind before these analyses are interpreted as meaning that Labour should be more left-wing. The first is that our analyses also show that perceptions of the economy were very important (as were leadership ratings). We don’t yet know whether it is possible for a party to be viewed both as strongly left-wing (or strongly right-wing) and as competent on the economy. The second is that, to win, Labour needs to win in Conservative-held seats, and arguably among Lib-Dems who have recently voted Conservative, and among Tory-leaning Ukip voters – as well as among others who voted Conservative in 2015. Labour needs to gain the support of centrist voters who didn’t vote for Labour in 2015 for reasons other than Labour’s left–right position. The third is that the above results are based on 2015 vote choices, and our analysis suggests that whatever Labour’s left–right position, Labour was unlikely to win in 2015.
In our opinion, Labour needs to give working-class, left-of-centre voters a reason to vote for the party again and the party needs to win support at the centre. It should resist choosing one over the other. The idea that one or the other route can be chosen is based on a false premise. It is also based on an outdated view of the electorate. When parties only lose votes (and seats) at the centre, it makes sense that elections are only won at the centre. But when fringe parties compete – when competition is between multiple parties on the right and the left – the picture is far more complex.
Jane Green is a professor of political science at the University of Manchester, and part of the leadership team of the British Election Study. Chris Prosser is a research associate at the University of Manchester and part of the British Election Study team.
This article appears in edition 22.2 of Juncture, IPPR's quarterly journal of politics and ideas, published by Wiley.
Homepage image: Financial Times/Flickr
Related items

Partner to scale: How international collaboration can enable the green transition
Scaling clean industrial technologies requires a shift from fragmented national strategies to targeted, durable international cooperation.
The Europe agenda: Trade and integration
This briefing note explores the options for the UK to deepen the trading relationship and sets out a proposed path forward.
Brexit 10 years on: Time the North took back control through devolution
Why does 'take back control' not extend to devolution?