Article
New regional economic data released today will help us understand the UK’s economy better, and help inform the government’s industrial strategy – especially given its focus on ‘place’.
These GVA figures (similar to national measures of GDP) show that between 2015 and 2016 – a year in which the Brexit referendum shocked the world. For the first time, relatively timely real-terms figures have been produced.
These figures have their flaws: they should be used in conjunction with other indicators to present a fuller picture and we shouldn’t read too much into yearly changes. They should certainly not be seen as a measure of economic progress – GVA growth does not necessarily mean growth in jobs or wages or reductions in poverty, as our recent experience has shown.
Nonetheless they have some value and the snapshot year-on-year changes should cause concern in many parts of the North.
LATEST GROWTH RATES
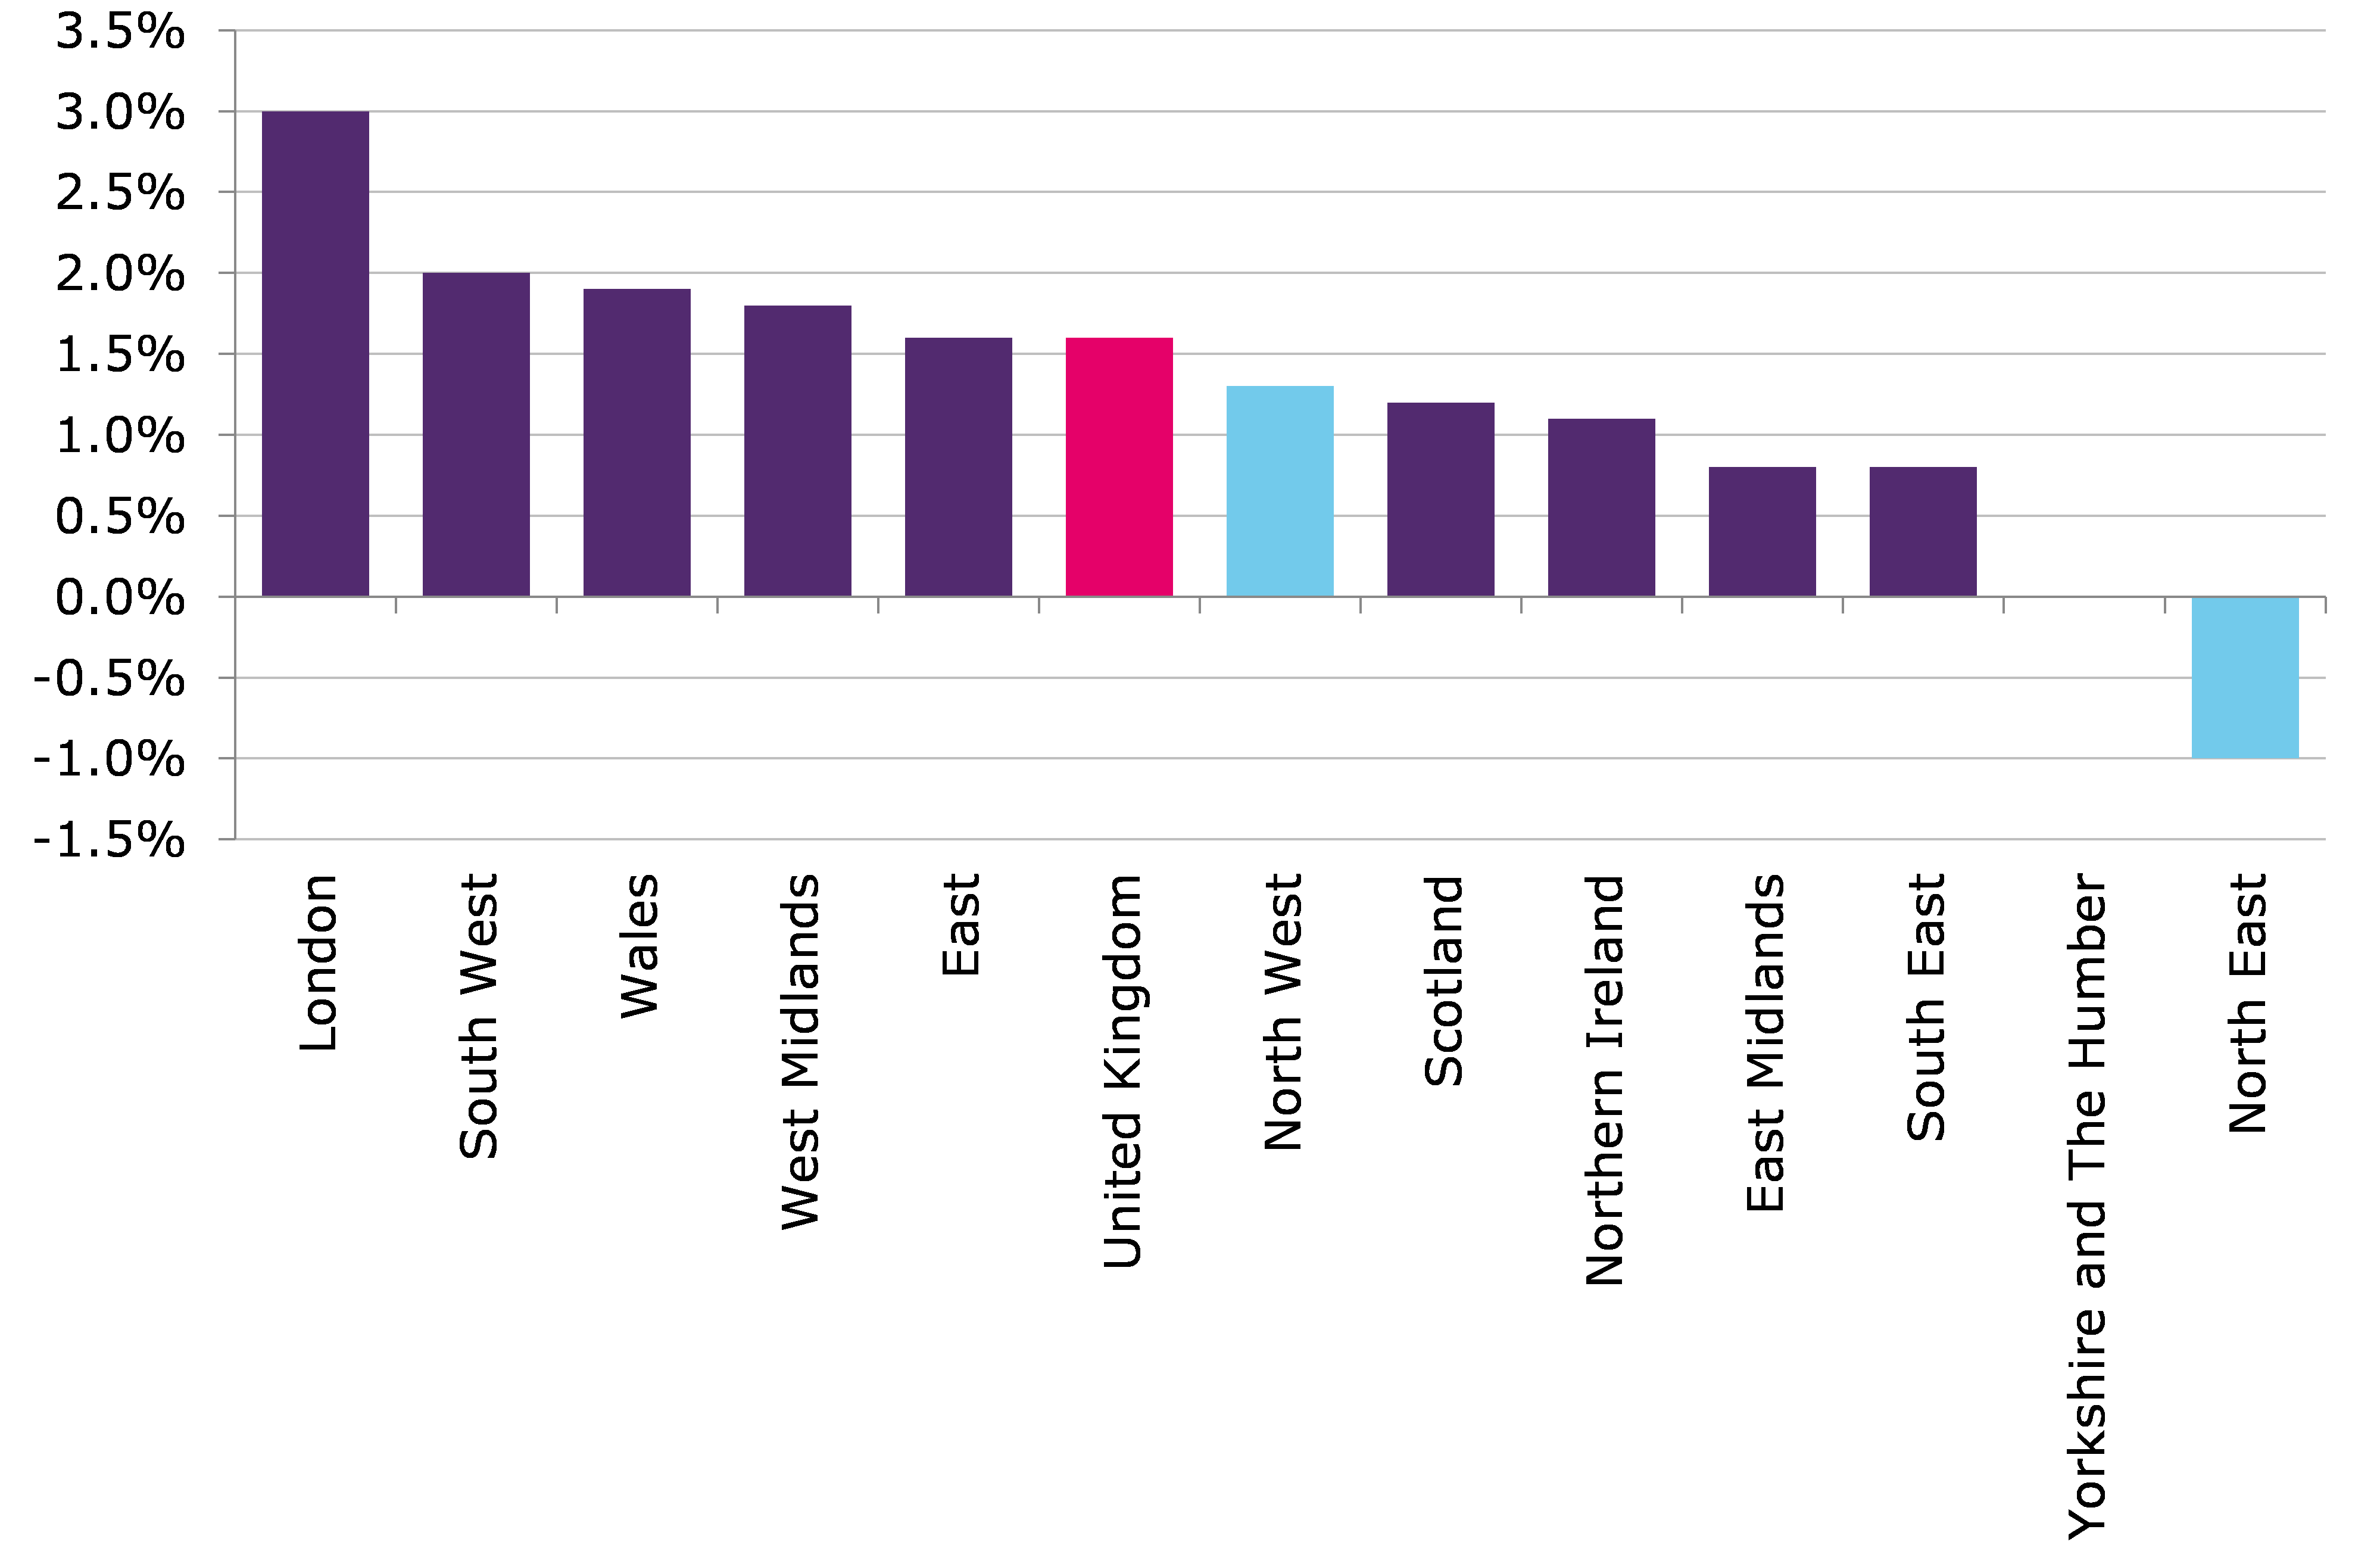
The North East is the only English region or devolved nation whose economy shrunk in this year, with GVA falling by 1.0 per cent. Yorkshire and the Humber saw no real terms growth. The North West fared better, but at 1.3 per cent growth was still below the national average of 1.6 per cent.
Figure 1: Per cent change 2015-2016 in regional GVA, real terms (chained volume measure)
 Source:
 But this misses the big picture. Or rather, the small picture: smaller areas within the North that are performing well – some of these outstandingly.
Cheshire grew at a rate of 3.7 per cent, second highest in the country and surpassed only by Inner London – West. Greater Manchester grew a rate of 2.3 per cent – more than the UK average, and more than some parts of London.
At a lower level of geography still, the nominal figures show there are many pockets of high growth within the North – primarily in the North West. In addition to parts of Cheshire and Greater Manchester, Warrington, and Blackburn and Darwen grew at a higher than average rate. Some parts of London – such as Lambeth – were among the poorest performers.
Figure 2: Per cent change 2015-2016 in NUTS-2 GVA, real terms (chained volume measure)
LONG-TERM PICTURE
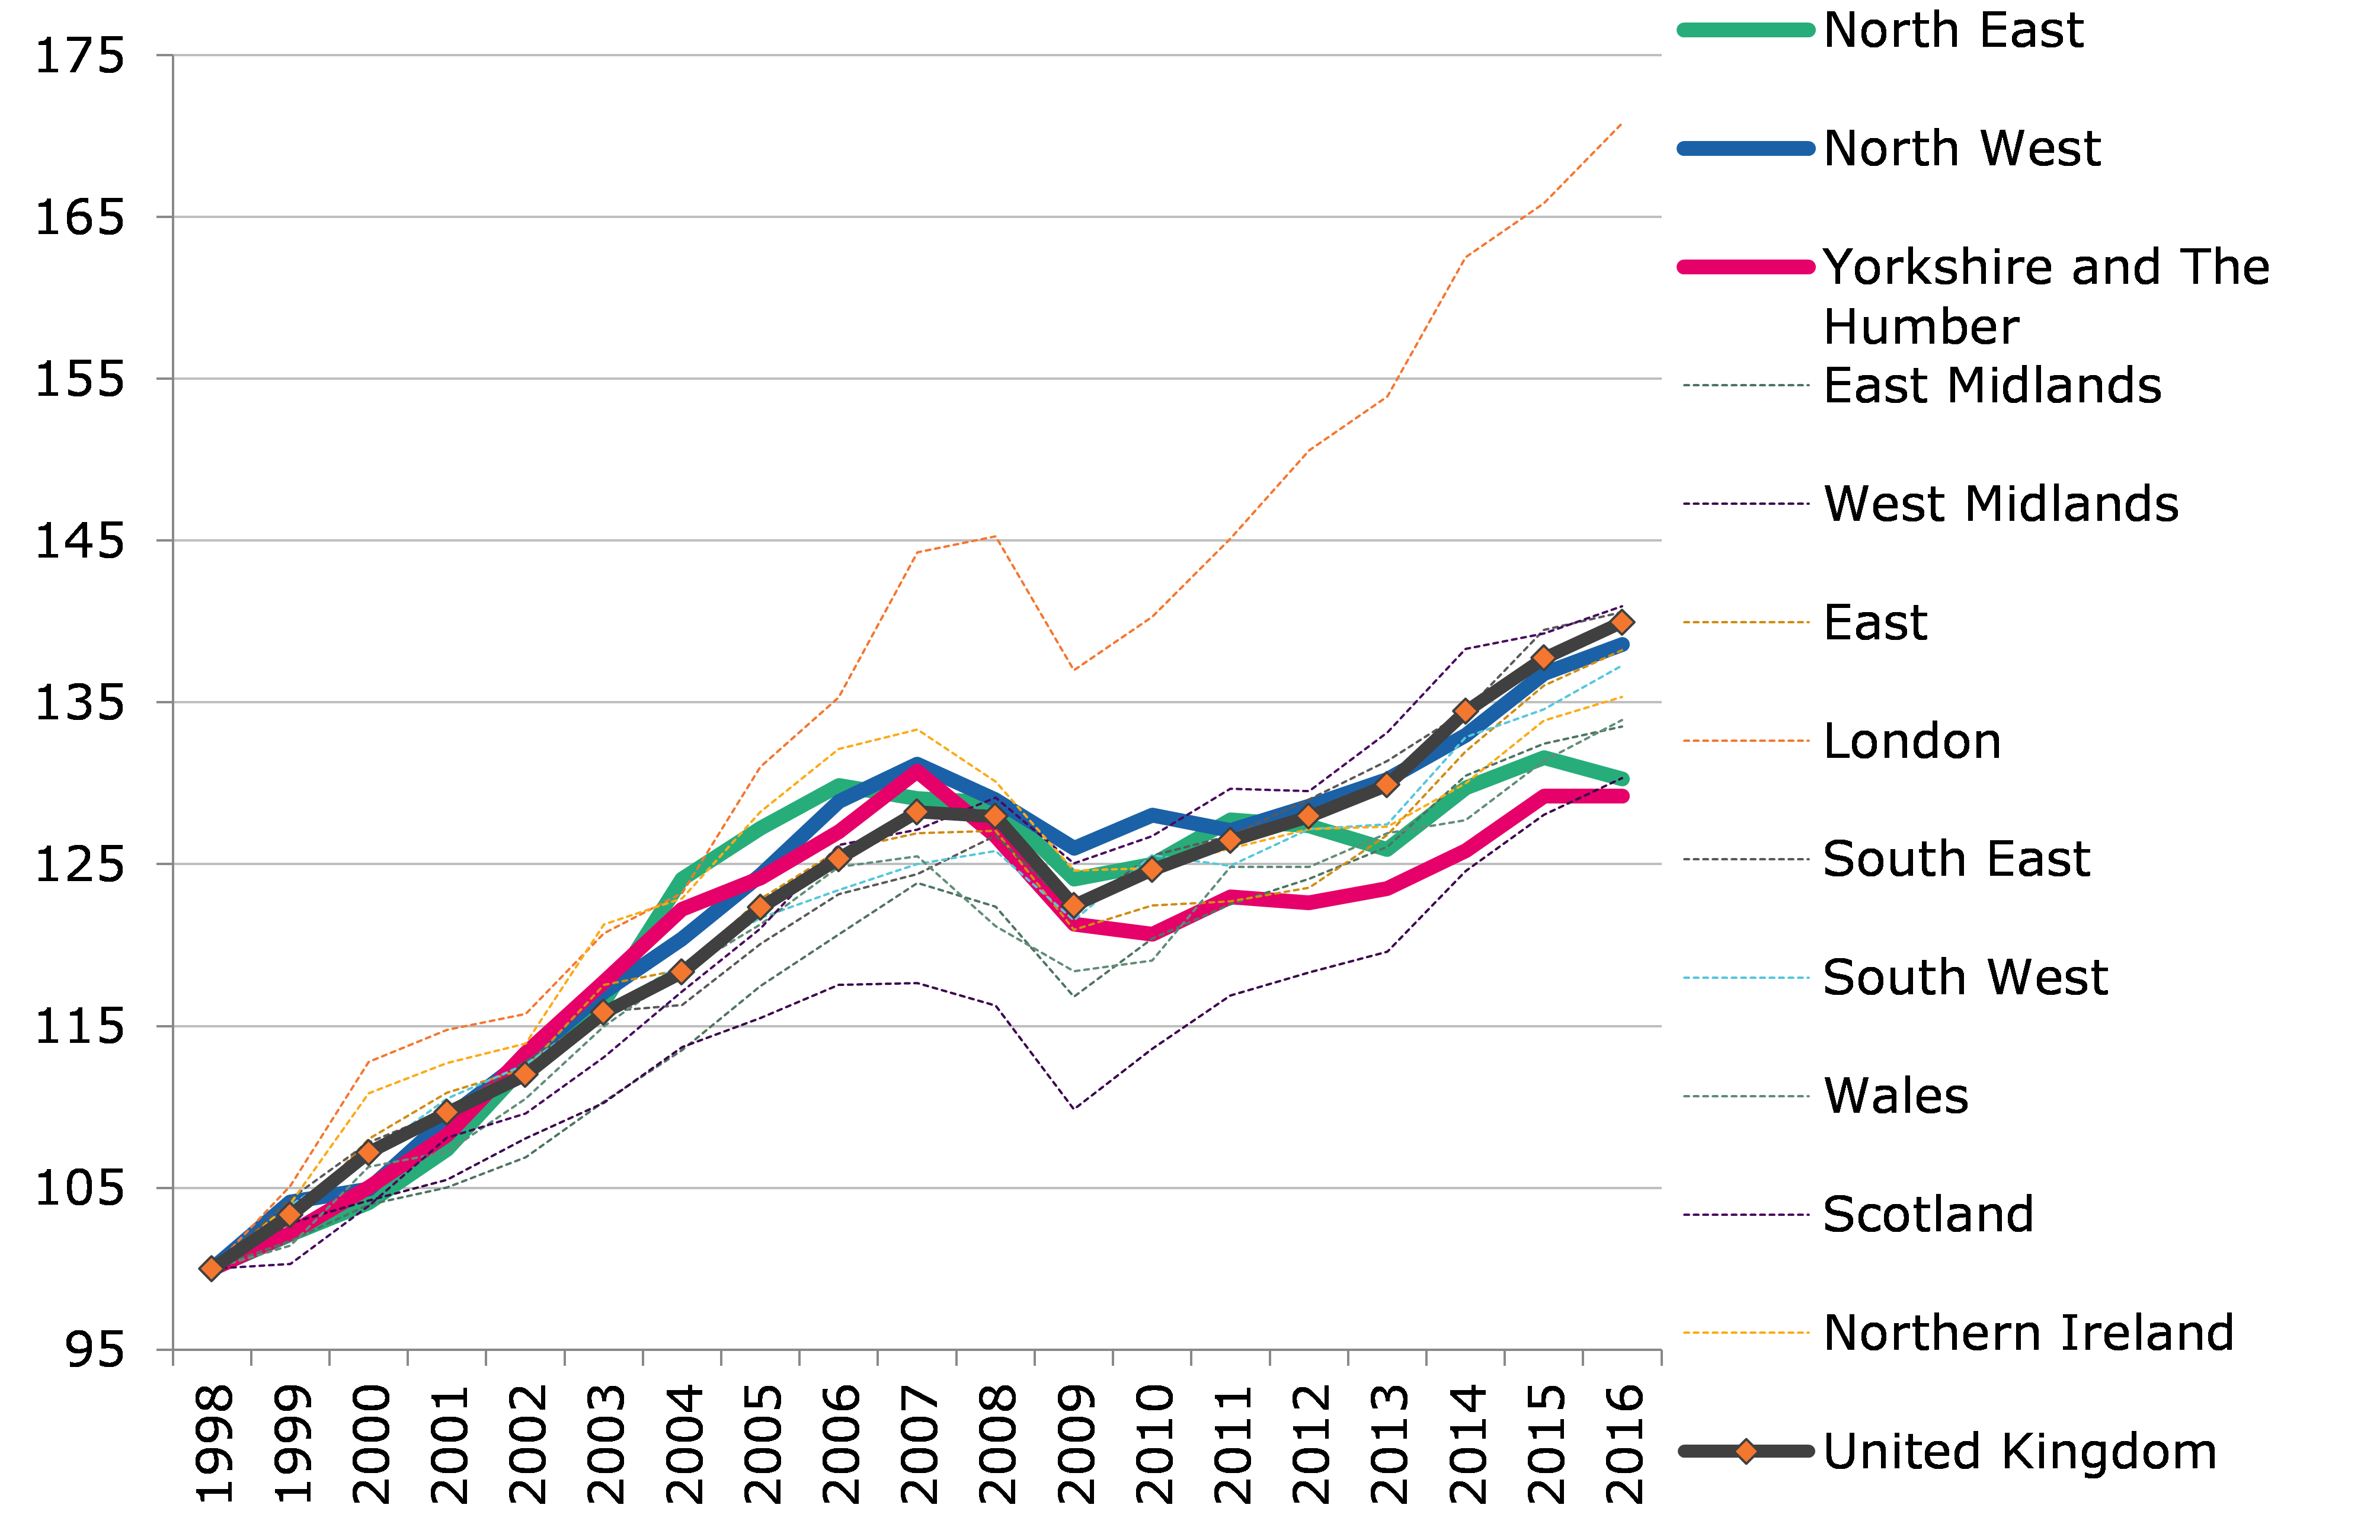
Over the long term this pattern is more nuanced but similar. First it is important to acknowledge that before the recession all three northern regions actually outpaced national growth. Post-recession however, the northern regions have struggled more than other parts of the country.
Figure 3: NUTS 1 regions GVA benchmarked to 1998, real terms (chained volume measure)
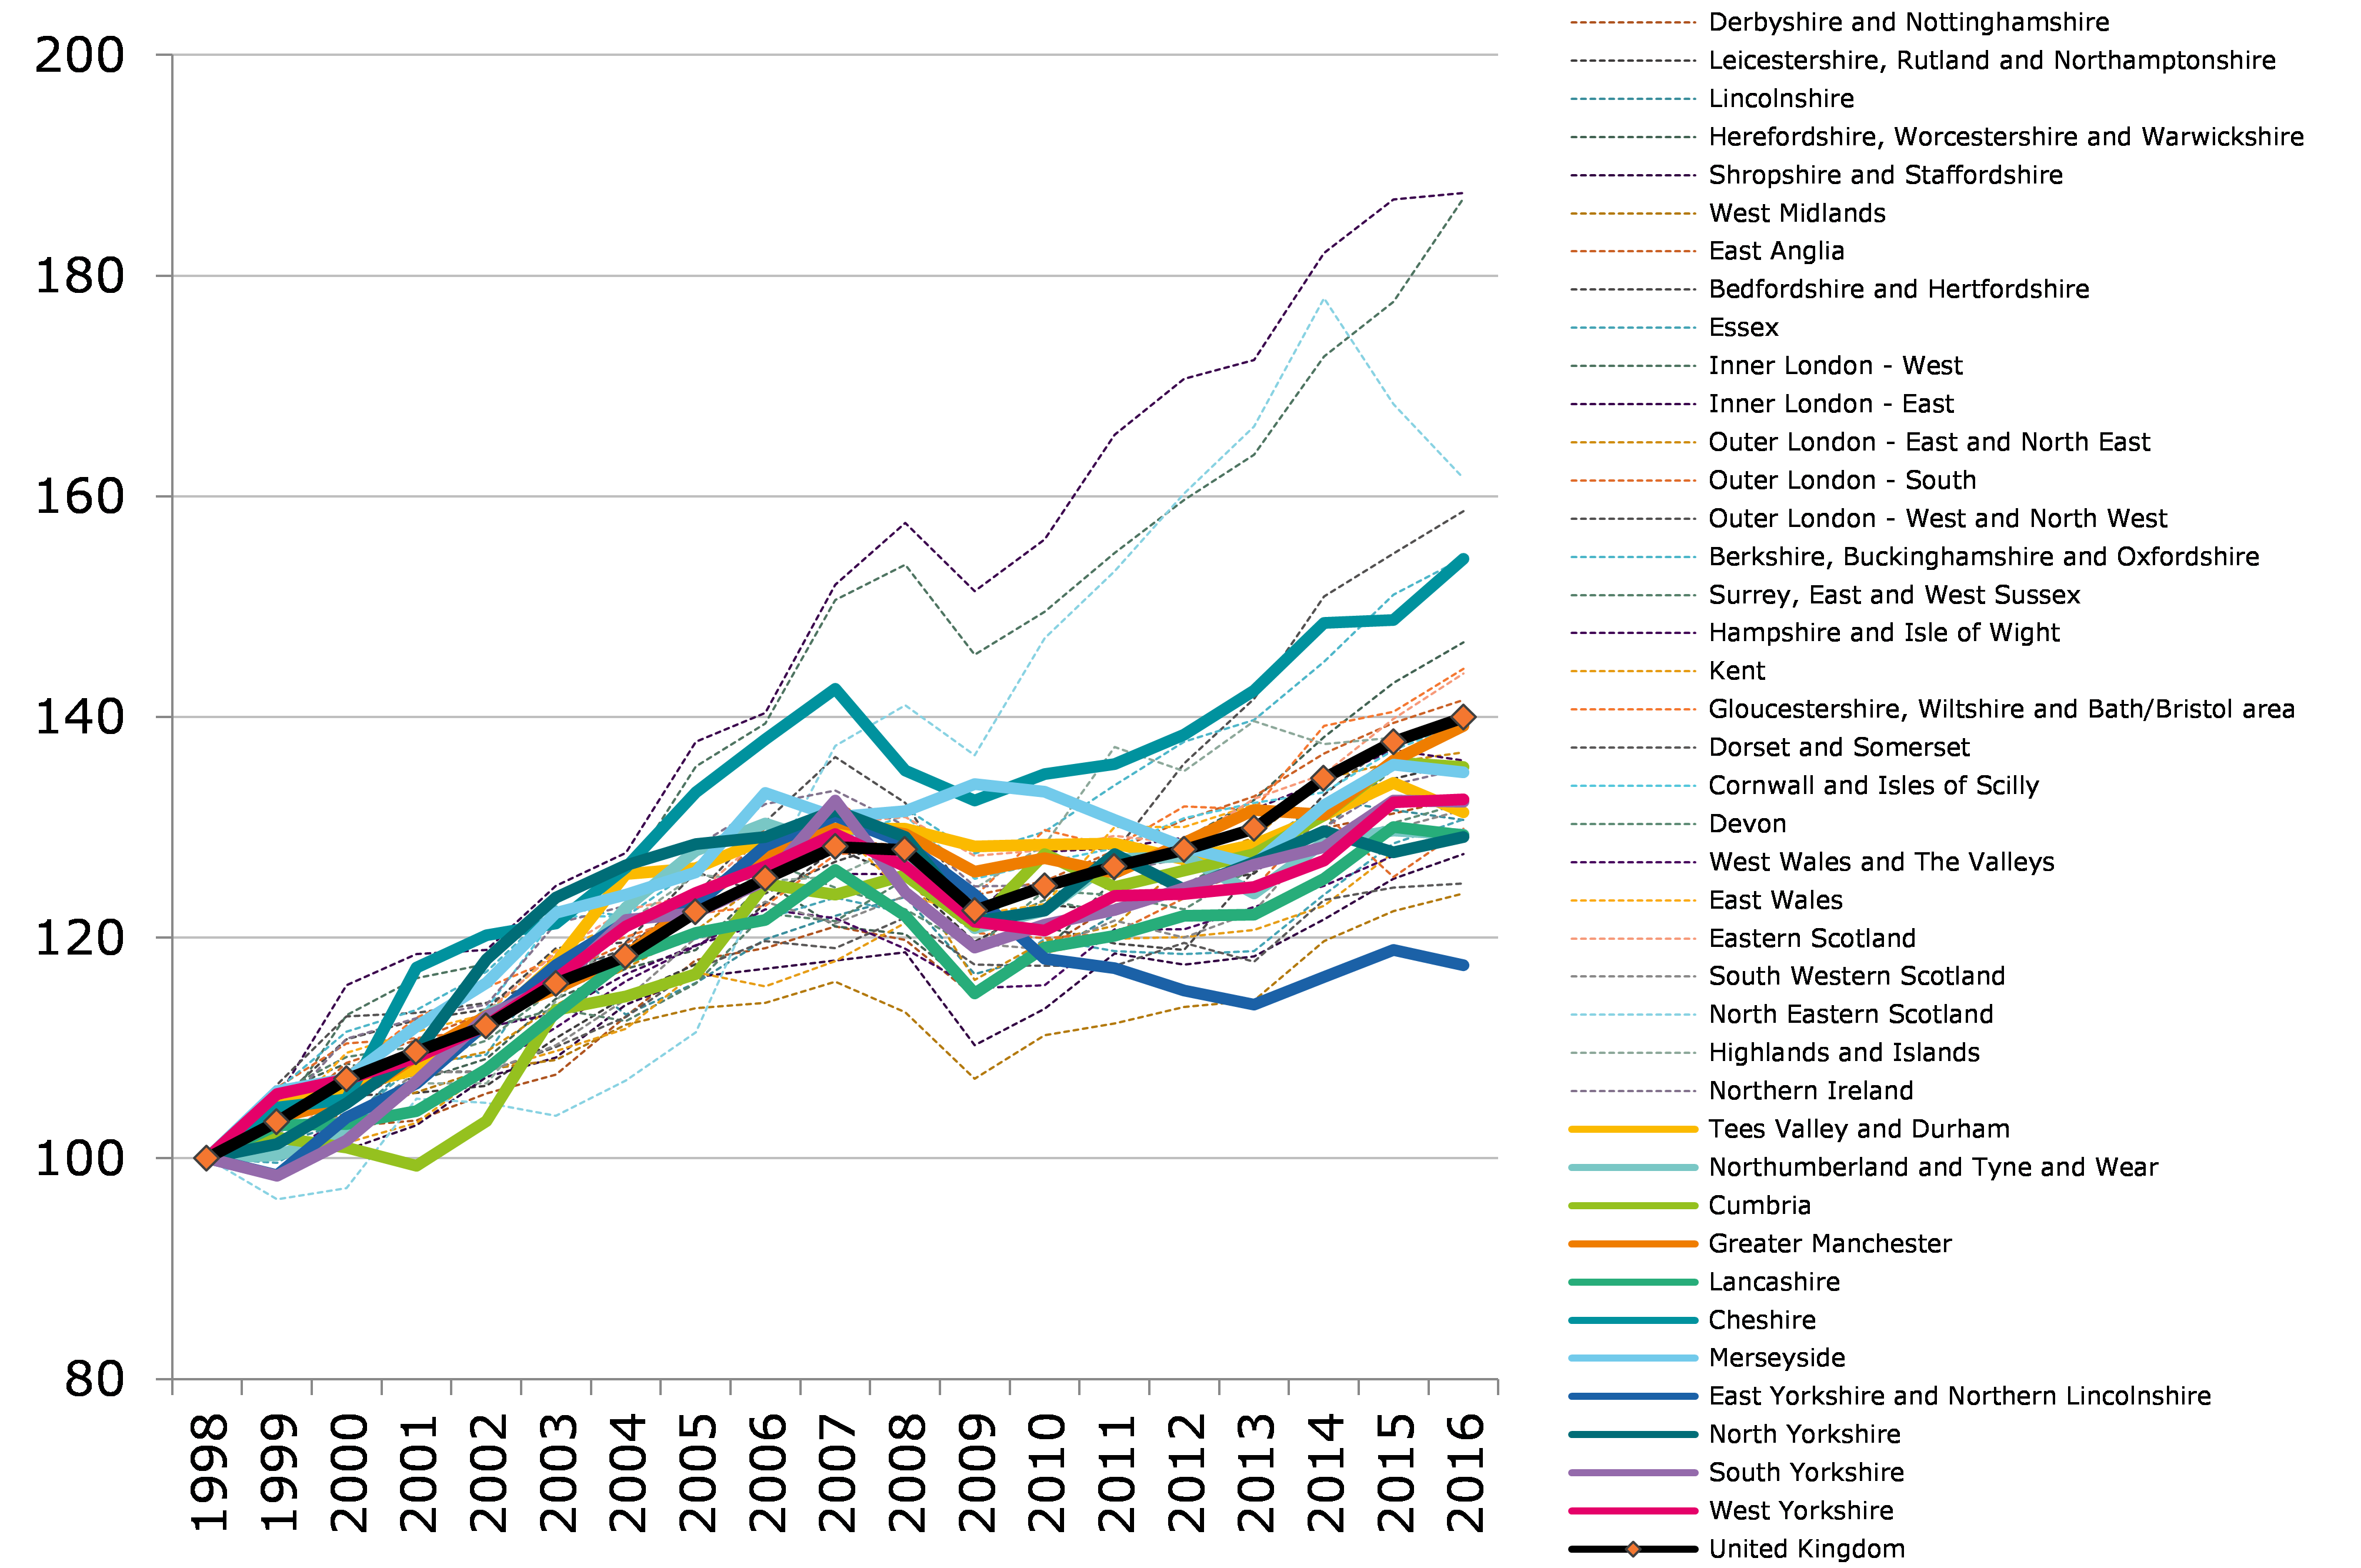
And at a lower geography, analysing all 18 years of growth data reveals a few notable trends. Firstly Inner London stretches way out ahead, with North East Scotland surging to catch up until falling significantly after the oil crisis in 2014.
Next there are parts of outer London, alongside Berkshire, Buckinghamshire and Oxfordshire who lead the pack of areas which significantly perform above average. From a Northern perspective it is here where Cheshire fits in too, consistently performing much better than most other regions alongside some of the strongest performers in the South. Greater Manchester’s growth has been consistently in line with UK-wide growth over this period, while Cumbria and Merseyside don’t lag too far behind.
There are a number of areas within the North that do lag behind however. East Yorkshire and Northern Lincolnshire grew slower than any other area over the whole period. This area actually out-paced UK growth pre-recession, but has tailed off each year since then. Tees Valley and Durham, Northumberland and Tyne and Wear, and Lancashire are also cause for concern, and sit with a number of under-performing regions, including Outer London - South, parts of the South West, and parts of Wales and Scotland.
Figure 4: NUTS 2 (sub-regions) GVA benchmarked to 1998, real terms (chained volume measure)
NORTH SOUTH DIVIDE?
These figures do not back up simplistic notions of North-South divide. They do not present a picture of a run-down North and a booming south, or back up an argument that economic policy should focus almost exclusively on London as a supposed engine of our economy. They do appear to show a great deal of potential outside of London, with some of this potential being realised and some of it not.
Luke Raikes is a Senior Research Fellow at IPPR North. He tweets at @lukeraikes
Related items

The Europe agenda: Our values
Why we must redesign our relationship with Europe around the values we share and want to defend.
Partner to scale: How international collaboration can enable the green transition
Scaling clean industrial technologies requires a shift from fragmented national strategies to targeted, durable international cooperation.
The Europe agenda: Trade and integration
This briefing note explores the options for the UK to deepen the trading relationship and sets out a proposed path forward.